Confidence Interval
As described in One Sample Hypothesis Testing, the confidence interval is given by
estimated mean ± critical value ∙ std error
![]()
Alternatively, by Property 1 of F Distribution, we can use the following as the critical value
![]()
We could have used 

Example using Excel format
Example 1: Find the confidence intervals for each of the methods in Example 3 of Basic Concepts for ANOVA.
To do this, we use the Analysis of Variance data analysis tool found in the Real Statistics Resource Pack. Press Ctrl-m and double-click on the Analysis of Variance option. Then select Anova: one factor from the dialog box that appears as shown in Figure 0.
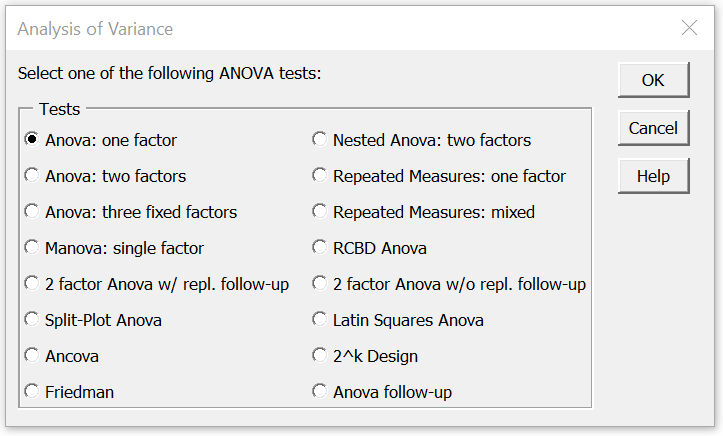
Figure 0 – Analysis of Variance dialog box
When using the multipage interface, you would instead click on the Anova tab and select the One Factor Anova option. In either case, the dialog box shown in Figure 1 is now displayed.
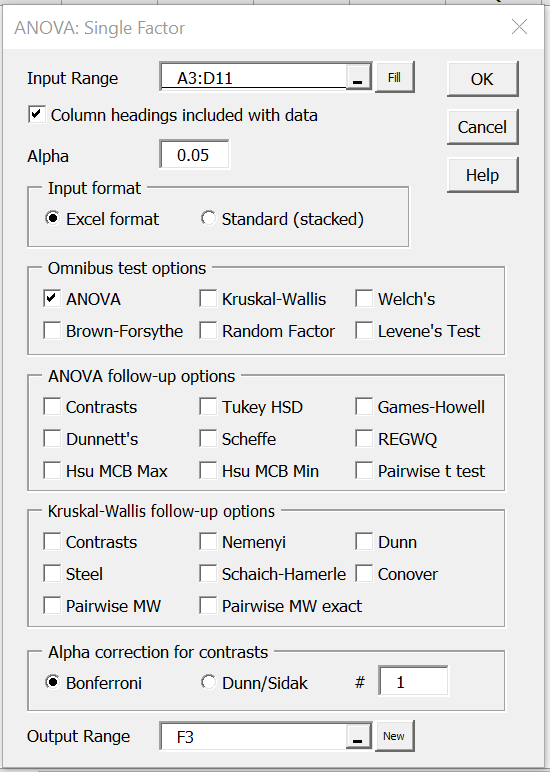
Figure 1 – Dialog box for Single Factor Anova
Enter A3:D11 in the Input Range, select Excel format with column headings as the Input Format, select the ANOVA option, and click on OK. The output appears as shown in Figure 2.

Figure 2 – Output of Real Statistics ANOVA data analysis tool
The confidence intervals are given in the range M7:N10. E.g. the confidence interval for Method 1 is calculated as follows:
![]()
tcrit = T.INV.2T(α, dfW) = T.INV.2T(.05, 25) = 2.06
Confidence interval = x̄i ± tcrit ∙ s.e. = 61.29 ± 2.06∙ 5.03 = (50.92, 71.65)
Note that most of the rest of the output in Figure 2 is similar to that found in the standard Excel data analysis tool (see, for example, Figure 5 of Basic Concepts for ANOVA). The entry for RMSSE is explained in Effect Size for ANOVA, while the entry for Omega Sq is explained in Other Measures of Effect Size for ANOVA.
Example using Stacked format
Example 2: Conduct ANOVA for the data in the range A3:B31 of Figure 3 (only the first 20 elements are shown). This time the data is stored in what we will call stacked or standard format. Here, the first column contains group names, and the second contains the corresponding scores. The data can be listed in any order.
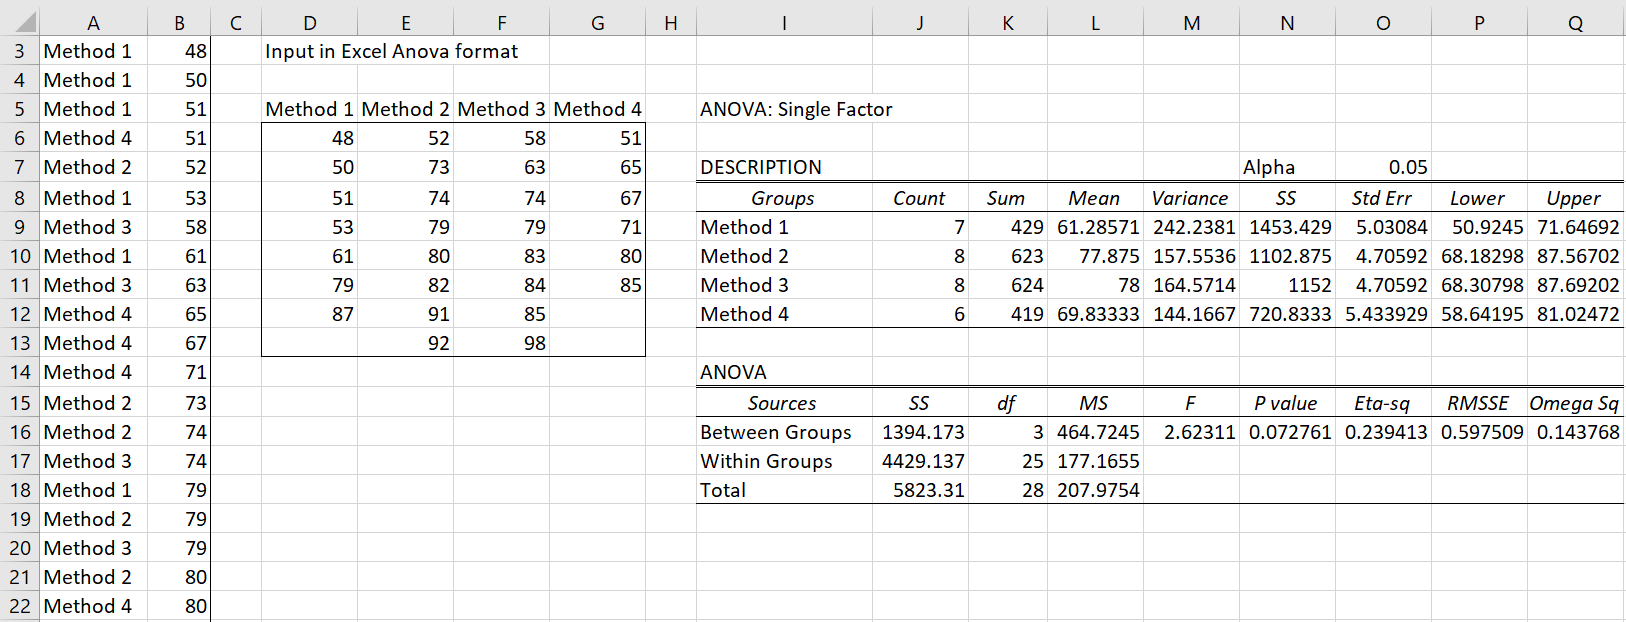
Figure 3 – ANOVA for input in standard format
To conduct the analysis, click on cell D3 (where the output will start), enter Ctrl-m and select Analysis of Variance, and press the OK button. Next, select Single Factor Anova from the dialog box that appears. A dialog box will then appear similar to that shown in Figure 1. This time enter A3:B31 in the Input Range, select Standard format as the Input Format, deselect Columns/row headings included with data, select the ANOVA option, and click on OK. The output appears in the rest of Figure 3.
Note that the data analysis tool first converts the input data from standard format to the usual Excel Anova format with column headings (range D5:G13). Since this data is the same as that used in Example 1, the ANOVA results are the same as shown in Figure 3.
Worksheet Functions
Real Statistics Functions: The Real Statistics Resource Pack contains the following two array functions for converting between Single Factor Anova format and standard format.
StdAnova1(R1) = takes the data in R1 which is in standard format and outputs an array with the same data in Single Factor Anova format.
Anova1Std(R1): takes the data in R1 which is in Single Factor Anova format, and outputs an array with the same data in standard format.
Referring to Figure 3, StdAnova1(A3:B31) yields the results shown in D5:G13. If you highlight the range S5:T35 and enter the array formula Anova1Std(D5:G3), the result is shown in Figure 4.
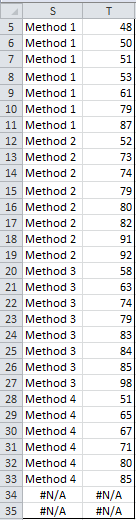
Figure 4 – Data in standard format
Note that the result is the same as range A3:B31, but in sorted order. Also, note that any extra entries are filled in with #N/A.
Real Statistics Functions: In One-way ANOVA Basic Concepts, we describe the functions SSW, SSBet and SSTot, which can be used for data in Excel format. The following functions provide the same functionality for data in standard format.
SSWStd(R1, col) = SSW
SSBetStd(R1, col) = SSBet
SSTotStd(R1, col) = SSTot
Here the first column of range R1 contains the names of the factor levels and the other columns contain data values. The column number col contains the data for the one-way ANOVA that we want to perform. If col is omitted, it defaults to 2 (the second column).
For the data in Figure 4, the formula =SSWStd(S5:T33) yields the value 4429.137, as seen in cell J17 of Figure 3.
Links
Examples Workbook
Click here to download the Excel workbook with the examples described on this webpage.
References
Howell, D. C. (2010) Statistical methods for psychology (7th ed.). Wadsworth, Cengage Learning.
https://labs.la.utexas.edu/gilden/files/2016/05/Statistics-Text.pdf
Schmuller, J. (2009) Statistical analysis with Excel for dummies. Wiley
https://www.oreilly.com/library/view/statistical-analysis-with/9780470454060/
Zar. J. H. (2010) Biostatistical analysis 5th Ed. Pearson
Hi Charles,
The pdf copy of the book having the link [https://bayesmath.com/wp-content/uploads/2021/05/Jerrold-H.-Zar-Biostatistical-Analysis-5th-Edition-Prentice-Hall-2009.pdf] does not contain all the pages. It was limited to 255.
Is it possible to have the link for the entire book…
Regards
Ritabrata Bhattacharya
Sorry, but I don’t have a link to a free copy of the whole book.
Charles
Dear Charles, thanks a lot for your helpful website.
I have a question regarding confidence intervals of individual group means. Specifically, I have 3 groups of data (n=3 for each group) normally distributed, with unequal variances. I performed Welch’s ANOVA, followed by the Games Howell’s post hoc test. I don’t want to display in a plot the results in the form of mean differences, intead I want to show the group means with their 95% confidence intervals and the p-values obtained by the post-hoc analysis test. How can I calculate the 95% CI for individual group means in this case with unequal variances?
Dear Niurka,
See https://real-statistics.com/excel-capabilities/chart-standard-errors/
Charles
Dear Charles, thank you for your reply. What I meant is the following: when I perform One-way ANOVA with the Real Statistics Resource Pack, the output shows the confidence intervals for the group means. In case of my data have unequal variances, I perform Welch’s ANOVA but I don’t find any calculated confidence interval for my group means in the output. So, am I wrong in using anyway the confidence intervals given in output by One-Way ANOVA when I represent my group means in a graph, given that I do not have equal variances?
Hi Niurka,
The ANOVA confidence intervals assume equal variances, and so you shouldn’t use these.
The approach I recommended just creates confidence intervals for the mean of each group separately assuming normality. If normality doesn’t hold you can also use a bootstrapping approach (as explained elsewhere on the website).
You don’t need ANOVA or Welch’s ANOVA to calculate these confidence intervals. The ANOVA test creates refined confidence intervals based on the assumption that the group variances are the same. You don’t want that.
I can’t recall whether the approach I recommended uses the standard errors based on a normal distribution or the t-distribution. The results should be similar, although the standard error based on the t-distribution will be a little better. To get more information about this, see
https://real-statistics.com/students-t-distribution/one-sample-t-test/
Charles
So, if I correctly understood, when I want to display my group means in a graph with their CI, it doesn’t matter which type of statistical test I performed: representing means is just representing means. What about the CI provided by the output of One-way ANOVA with the Real Statistics Resource Pack? Should I use them when graphing group means of data normally distributed and with equal variances? And why not using the CI formula for Z (or t) distribution given that representing means is just representing means? In my case, I finally calculated the 95% CI for my group means using the formula: observed mean ± tα/2;n-1 ⋅ (s/√n) and I displayed them in a graph with the p-values obtained with the Games-Howell post-hoc test. Hope this approach is correct.
Niurka,
I believe that everything you said is correct. Please recall that the Games-Howell test will report results for pairs of groups, which probably what you want.
Yes, the CI provided as output from Real Statistics’ One-way ANOVA assumes each group of data is normally distributed and the variances of the groups are equal.
Charles
Hi Charles,
I am seeing a different dialogue box that does not show any ANOVA follow-up options. I’m fairly certain it used to be there, but has changed to a really basic box that just asks for input. Any thoughts on how to fix it?
Thanks!
Hi Renee,
The dialog box hasn’t changed. It should still include ANOVA follow-up tests.
What is the name of the analysis tool that you are using? Or send me a screen shot of the dialog box.
Charles
Hi there,
I know this was asked awhile ago, but I ran into the same issue and was wondering if it was resolved. I’m not seeing any additional options in the ANOVA dialog box to check the Dunnett’s test. Thank you for any potential help!
Jenna
Hello Jenna,
Yes, you can access Dunnett’s test from the One Factor Anova data analysis tool.
Charles
Hi,
The ctrl-m is not working on my excel sheet and I was not able to perform the Tukey test. Is there alternative for the ctrl-m?
Thanks
What do you see when you insert the formula =VER() in any cell?
Charles
#NAME?
Hello Dima,
This means that the Real Statistics addin has not been installed. You need to follow the installation instructions on the webpage from where you downloaded the Real Statistics file.
Charles
thanks for the site. I ve learned a lot
Hello,
First of all, I just wanted to say thanks for providing so much in depth analysis and explanation of the ANOVA test. I am, however, experiencing a minor problem with the test. When I try to complete the test with the alpha value of 0.05, a tab opens that says that it has to be a value between 0 and 0.5. Someone told me that this is a bug in the system and there is a different way that works, however, I was unable to locate the fix to this problem on your website. Could you please explain?
Kind Regards
Zelda
Hello Zelda,
See https://real-statistics.com/appendix/faqs/comma-as-decimal-symbol/
Charles
Hello again,
Thank you so much for your quick reply! This was really helpful.
Kind Regards
Zelda
Does not work the macro, whenever I select my data as per the example and click OK, it says invalid input range. Yes, I am selecting data in columns that are next to each other and are even balanced.
Hello Ale,
If you email me an Excel file with your data and what sort of analysis you are trying to do, I will try to see what is causing this problem.
Charles
Dear Charles,
First, thanks for the great software and support you provide.
I have a question:
I conduct a study with a 2×2 between-subject design (where participants have been assigned randomly to the 4 different groups).
Now I want to test whether the 4 groups are structurally equal with regard to age, gender, etc.
My question is, whether I can use a one-factor-ANOVA to test the group equality with respect to the different characteristics.
Thanks in advance!
Best
Fabian
Fabian,
If you know the ages of all the participants in each of the 4 groups, then you can use one-factor ANOVA to test whether there are significant differences in age between the groups. You can do the same for other characteristics.
If the participants were assigned randmly to the 4 groups, then you shouldn’t expect any significant differences in age.
Charles
Hi Charles
For a test with different methods. How do I determine the method with the highest yield?
Sorry Christian, but I don’t understand your question.
Charles
Thanks for the the information you provided and all the best of luck in your future publications. Please, I would be happy to have you explain in details what the mean of the observations in the ith treatment means to someone who’s calculating the CI manually. Thanks and best regards!
Glad you are getting value from the website.
In general, if (a,b) is a 95% confidence interval for some population parameter p, then if you rerun the experiment a large number of times, each time generating a random sample, then 95% of the time the sample estimate of parameter p will lie in the interval (a,b).
Although, not really accurate, people tend to think of this as meaning that the true parameter value has a probability of 95% of lying in the interval (a,b). As I said, this is not technically correct, but it is a way of getting a feel for the value of the confidence interval.
Charles
Dear Charles,
I have data from fetilizer trail on vegetable, five levels of fertilizer are my treatments, replicated three times. The data was taken on three growth parameters (number of leaves, stem girth and plant height) and two yield parameters (leaf weight and stem weight). My question is:
1. Do I use one-way or two way ANOBA?
2. Should I analyse the whole data once or one by one (i.e to analyse data on number of leaves alone, then stem girth, and so on or analyse them together?
Thank you
Dear Charles, many thanks for this awesome software.
I have a question related to the calculation of the confidence intervals.
Performing the ANOVA in Minitab or JMP it can be seen, that the intervals are slightly different (narrower) to the one calculated with your add-on. Can you (or someone other) give me an explanation of this behavior.
Thanks Heinrich
Heinrich,
Since I am not familiar with Minitab or JMP, can you send me an Excel file with your data and the results you have received using Excel? Also please send me the results you got from Mintab and JMP. I will then try to figure what is happening.
You can get my email address from the Contact Us webpage.
Charles
Suppose we take the data in the standard format and compute the squared deviations from the overall mean divided by the overall sample variance to obtain an “expected” series. Then do the same using observed sample means and variance for each group as appropriate to obtain an observed series. If we now apply the Ch-sq. goodness of fit test to the two series, would that be equivalent to ANOVA? Would it make sense, anyway?
Have you tried doing this?
I just tried and the results are completely different.
Charles
Zaiontz:
i really like your array formulas–great adds! i might be misunderstanding something about them, however: For, say, n rows where there are, say, 3 missing datapoints, i think StdAnova1(R1) gives n datapoints with 3 zeroes instead of (n-3) datapoints with 3 nulls. Is that correct? If so, how do we get around this?
Nate,
Before using the StdAnova1 function or Anova data analysis tool, you could eliminate missing data by using the DELROWBLANK function (assuming the missing data are blanks). Alternatively you can use the Reformatting a Data Range by Rows data analysis tool (accessible by pressing Ctrl-m).
Charles
Hi Charles,
Could you please state the exact form of confidence interval for a ~difference of means~ between two groups? For instance, in your e.g. between method1 and method2; what would be the t statistic, the df, the relevant n value for the s.e statistic? Is it like in an independent t test? When df=n1+n2-2 etc.? I’m trying to figure it out with the numbers and seem to get lost.. SPSS claims the mean difference between those groups is -16.589, which I obviously understand, but the 0.05 CI is [-35.537,2.3592] (one side equals to 18.948).
Would highly appreciate your explanation.
Best regards and many thanks in advance,
Yohay.
Hi Yohay,
The referenced webpage explains how to calculate the confidence interval for the mean of each single method. This is like a one sample t test.
You are asking about the confidence interval for a difference between group means. Since the groups are independent, this is like a two independent samples t test. This is considered a follow up to a ANOVA, and is discussed on a different webpage, namely the webpage https://real-statistics.com/one-way-analysis-of-variance-anova/planned-comparisons/. (You need to consider the comparison where one method gets comparison coefficient +1 and the other gets comparison coefficient -1). Please read that webpage and let me know whether it answers your question.
Charles