Overview
One caution about estimating the minimum sample size for ANOVA is that this sample size is not necessarily the required size for any of the follow-up tests. In fact, as we shall see, the required sample size for a Tukey HSD test may be larger than that required for the omnibus ANOVA.
Since there is no simple analytic approach to estimating the power of Tukey’s HSD test, we will use simulation. This is similar to the approach we use for the Mann-Whitney and Signed-Ranks tests (see Mann-Whitney Power and Signed-Ranks Power).
Example
Example 1: Suppose we expect to run one-factor ANOVA with three groups, each with 15 elements. Furthermore, suppose that the effect sizes for the three groups are .2, .5, and .7. Determine the power of the three pairwise comparisons.
Based on the homogeneity of variances and normality assumptions, we can assume that the three groups have means of .2, .4, and .7 and a standard deviation of 1. We, therefore, create a random normally distributed sample with three columns and 15 rows, where the expected means of the three columns are .2, .4, and .7. Figure 1 shows how to accomplish this.
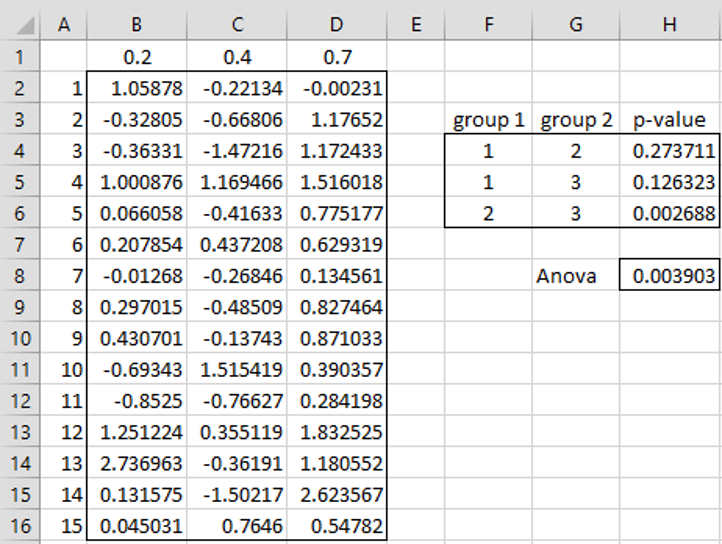
Figure 1 – One simulation
To create the random sample, insert =NORM.INV(RAND(),B$1,1) in cell B2, highlight the range B2:D16, and press Ctrl-R and Ctrl-D. We calculate the Tukey HSD results for this sample by placing the array formula =TUKEY(B2:D16) in F4:H6. We calculate the ANOVA p-value by placing the formula =ATEST(B2:D16) in cell H8.
Based on a significance level of alpha = .05, we see from this simulation that only the group 2 – group 3 comparison and omnibus ANOVA are significant.
Iteration
Now we repeat this process a large number of times and calculate the number of significant results for each of the three Tukey HSD comparisons as well as the omnibus ANOVA test. An estimate of the power of each of these four tests is the total number of significant results divided by the total number of simulations. Figure 2 shows the results after 100 and 1,000 simulations using the following Real Statistics function.
Worksheet Function
Real Statistics Function: The Real Statistics Pack provides the following array function where R1 is a column array containing the effect size for each of m groups (1 through m).
TUKEY_POWER(R1, n, iter, alpha, clock): returns an array with 3 columns and C(m,2) + 1 rows, with the first row corresponding to the ANOVA test and the other rows corresponding to all possible pairwise group comparisons. Except for the first row, the first two columns contain the group numbers from 1 to m that are being compared,, and the third column contains the power for each of the pairwise comparisons. The first row contains the label “anova” and the power of the ANOVA test.
n = the number of elements in each group; iter = the # of simulations (default 100); alpha is the significance level (default .05). If clock = TRUE (default FALSE) then the first element in the output represents the time elapsed to create the output in seconds; this can be useful information since processing times can get fairly long, especially for larger numbers of simulations.
Example 2: Repeat Example 1 using the TUKEY_POWER function
We show the results in Figure 2.
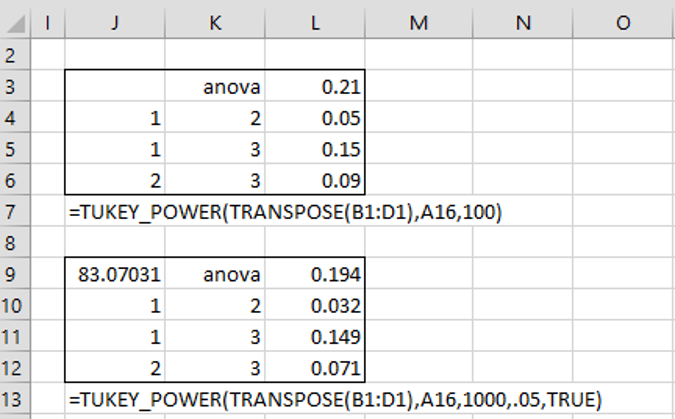
Figure 2 – Power results
We see that with only group samples of size 15, none of the power values is particularly large. Note that while it took about 11 seconds on my computer to get the results with 100 simulations, it took 83 seconds to get the results, presumably more accurate, with 1,000 iterations.
Sample Size
If we want to determine the minimum sample size required to achieve, say, 80% power, we need to progressively increase the sample size values (i.e. n) until the desired power is achieved. Note that we need to do this separately for each group comparison as well as for the omnibus ANOVA.
Since the processing can be relatively slow, I chose to perform this experimentation with iter = 100, and then once I found an acceptable power, I increased the number of iterations to 1,000. The results are shown in Figure 3.

Figure 3 – Sample size requirements
We see that to achieve 80% power for the ANOVA test, group samples of size approximately 75 are needed. To achieve 80% power for groups 1-3, the sample sizes are about 85; for groups 2-3 the minimum sample sizes are about 225, and for groups 1-2 about 500 are needed.
It is clear that if we base our sample size requirements on the ANOVA test only, we won’t achieve 80% power for any of the comparisons, and if we are expecting to test groups 2-3 or 1-2, then we will severely underestimate the sample sizes required.
Observation
The sample sizes don’t depend on the effect sizes, but on the differences between the effect sizes. For Example 1, these are .2, .3, .5, corresponding to 1-2, 2-3, and 1-3. Thus, we expect to get the same sample size requirements with effect sizes (i.e. means) 0, .2, .5. Thus, each possible m-tuple of effect sizes is equivalent to an m-tuple where the effect size of group 1 is zero.
Figure 4 contains the required sample sizes for three groups assuming that the effect size for group 1 is 0 and the effect sizes for the other two groups are as listed (based on 20,000 iterations).

Figure 4 – Sample size requirements for 3 groups
From this figure, we see that the sample size requirements for Example 1 are 77 for ANOVA, 508 for 1-2, 230 for 2-3, and 82 for 1-3. These are close to the values we found in Figure 3.
Links
Examples Workbook
Click here to download the Excel workbook with the examples described on this webpage.
Reference
Brooks, G. P. and Johanson, G. A. (2011) Sample size considerations for multiple comparison procedures in ANOVA. Journal of Modern Applied Statistical Methods. Vol. 10, No. 1, 97-109.
https://digitalcommons.wayne.edu/jmasm/vol10/iss1/10/
I tested the aggressiveness of 102 isolates of the sample species. I want to now use a Tuiey hsd test to check the if the aggressiveness is different. Can I use this method?
I would need more details about the scenario to answer your question.
Charles
I needed to transform the data because they did not guarantee the assumptions for ANOVA. I made a transformation in LN .
With the transformations, the ANOVA assumptions were contemplated.
I ran a single factor ANOVA and everything was fine.
But, in my understanding, TUKEY is presenting an inconsistency when we compare mean and critical mean and try to validate the result through the p value.
Would you help me?
Hello Marco,
Can you explain this inconsistency further? I don’t understand what you have written.
Charles