Basic Concepts
The Brown-Forsythe test is useful when the variances among the groups are not equal. This test uses the statistic F* and is based on the following property.
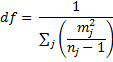
Property 1: If F* is defined as follows
![]()
then F* ~ F(k – 1, df) where the degrees of freedom (also referred to as df*) are
and
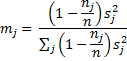
With the same-sized samples for each group, F* = F, but the denominator degrees of freedom will be different. When the ANOVA assumptions are satisfied, F* is slightly less powerful than the standard F test, but it is still an unbiased, valid test. When variances are unequal, F will be biased, especially when the cell sizes are unequal; in this case, F* remains unbiased but valid.
Example
Example 1: Repeat Example 2 of Basic Concepts for ANOVA using the Brown-Forsythe F* test.

Figure 1 – Brown-Forsythe F* test for Example 1
We start by running the Anova: Single Factor data analysis on the data in the range A3:D11 in Figure 3 of Basic Concepts for ANOVA. The result is shown on the left side of Figure 1. We then add the total sample size (cell G11) using the formula =SUM(G7:G10).
We next build the two tables on the right of Figure 1. Cells in the range N7:N10 contain the numerators of the formulas for the mj described above. The sum of these (in cell N11) is the denominator of the quotient that produces F*. Cells in the range O7:O10 contain the mj. Cells in the range P7:P10 contain the values in the denominator of the formula for df. The reciprocal of the sum of these values is df (in cell P11). Figure 2 contains some of the key formulas for the implementation.

Figure 2 – Representative formulas in Figure 1
Note that since df*is not an integer, we elect to use F_DIST_RT instead of F.DIST.RT to get a more exact p-value.
Since variances of the data are quite similar and the samples are of equal size, the F and p-values from Brown-Forsythe are not much different from those in the standard ANOVA of Example 2 of Basic Concepts for ANOVA.
Worksheet Functions
Real Statistics Functions: The Real Statistics Resource Pack contains the following worksheet functions where R1 is the data without headings, organized by columns:
BFTEST(R1) = p-value of the Brown-Forsythe’s test on the data in R1
FSTAR(R1) = F* for the Brown-Forsythe test on the data in R1
DFSTAR(R1) = df* for the Brown-Forsythe’s test on the data in R1
For Example 1, we have BFTEST(A4:D11) = .044935, FSTAR(A4:D11) = 3.0556, and DFSTAR(A4:D11) = 27.5895 (where A4:D11 refers to Figure 3 of Basic Concepts for ANOVA). If the last sample element in Method 1 and the last two sample elements in Method 4 are deleted (i.e. the data in Example 3 of Basic Concepts for ANOVA), then BFTEST(A4:D11) = .074804, and so this time there is no significant difference between the four methods.
Finally, the following array function combines all of the above functions:
FSTAR_TEST(R1, lab): outputs a column range with the values F*, df1, df2, and p-value for Brown-Forsythe’s F* test for the data in range R1.
If lab = TRUE, a column of labels is added to the output, while if lab = FALSE (default) no labels are added.
Data Analysis Tool
Real Statistics Data Analysis Tool: The Real Statistics Resource Pack provides access to Brown-Forsythe’s F-star test via the One Factor ANOVA data analysis tool, as described in the following example.
Example 2: Repeat Example 1 using the data on the left side of Figure 3.
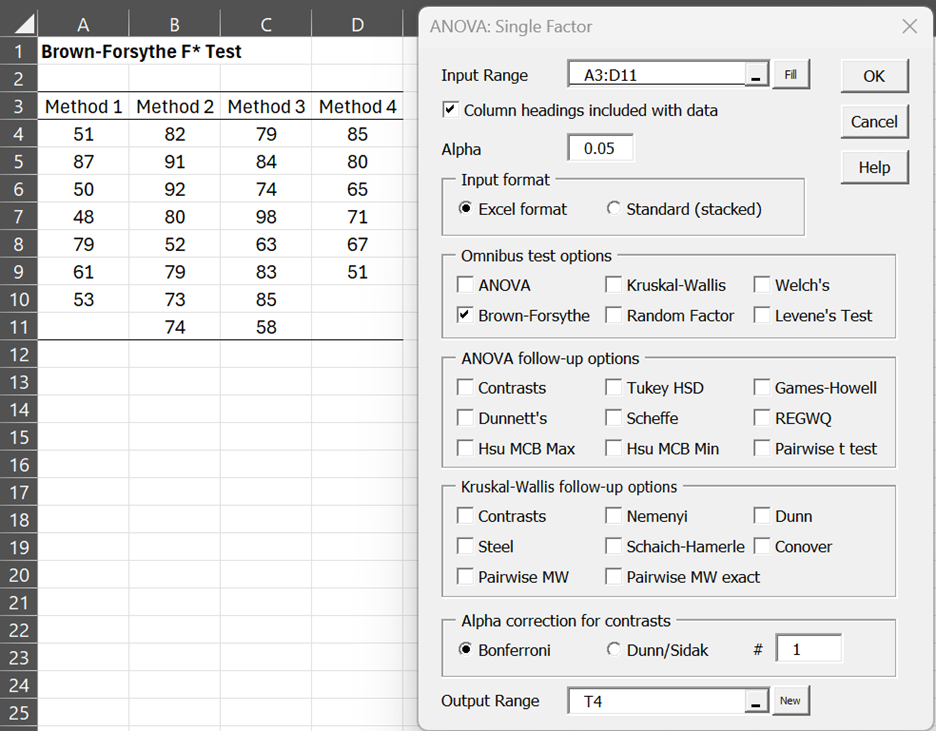
Figure 3 – Brown-Forsythe data and dialog box
Enter Ctrl-m and double-click on Analysis of Variance. Select Anova: one factor on the dialog box that appears. Now fill in the dialog box that appears as shown on the right side of Figure 3.
The output is shown in Figure 4.

Figure 4 – Brown-Forsythe F* data analysis
Links
Examples Workbook
Click here to download the Excel workbook with the examples described on this webpage.
References
Delcre, M., Levs, C., Mora, Y., Lakens, D. (2019) Taking parametric assumptions seriously: Arguments for the use of Welch’s F-test instead of the classical F-test in one-way ANOVA
https://pure.tue.nl/ws/portalfiles/portal/143487258/198_2046_1_PB.pdf
GraphPad (2024) Interpreting results: Welch and Brown-Forsythe tests
https://www.graphpad.com/guides/prism/latest/statistics/interpreting_welch_browne-forsythe_tests.htm
Hi Charles,
I do not have much stats experience at all and I am trying to determine if the BF test is what I need. I was hoping to get your insight on this please.
I have study data whereby each patient has taken 3 repeated measurements on themselves with 1 device. These 3 measurements are then taken with device #2 and #3 (so each patient has a total of 9 repeated measurements but by 3 different devices – 3 measurements taken by device #1, 3 measurements taken by device #2, and 3 measurements taken by device #3). I want to see if the variation between the 3 measurements taken by device #1 is different than the variation between the 3 measurements taken by device #2 is different than the variation between the 3 measurements between device #3. I.e. I want to show if there is one device that is more reliable and whose readings cluster more closely together and have better repeatability.
Would the BF test be appropriate to use in this situation?
Hello JQ,
This Brown-Forsythe test is a substitute for ANOVA when some of the assumptions are not met. If I understand correctly, you want to compare the variance between three devices.
There are a number of tests for this purpose, including one called the Brown-Forsythe test for homogeneity of variances, but this is not the same test. You can get more information about this and related tests at
https://real-statistics.com/one-way-analysis-of-variance-anova/homogeneity-variances/
Charles
How do i report this BF output pls Robust Tests of Equality of Means
Sanitation type
Statistica df1 df2 Sig.
Brown-Forsythe 65.372 9 1320.483 .000
a Asymptotically F distributed.
This depends on the requirements of the journal. Generally, the APA requirements are followed. You can probably use the guidelines for one-way ANOVA plus explain why you used this test rather than ANOVA or some other test.
Charles
Hi Charles,
Hope everything is going well. I’ve been curious as to the denominator degrees of freedom adjustments in the Brown-Forsythe and Welch F ratios. These adjusted degrees of freedom are rarely whole numbers. How are these fractional degrees of freedom interpreted in the “real world?” Are they just rounded to the nearest integer? More to the point, if degrees of freedom indicate the number of equations needed to model a given experimental setup, or perhaps the number of “chances” to build up variation, for lack of a better term, how can fractional degrees of freedom even exist? You can’t have a fraction of a modeling equation, it’s either there or it isn’t as far as I’m aware. Am I missing something? I have a feeling that the reasoning might be a little beyond my capacity to understand, but I’m intrigued nevertheless.
Keep up the great work!
Hello Kevin,
Sorry for the delayed response. With the pandemic, I have been receiving an unbelievably large number of comments and I am constantly trying to keep up. Who knew that people would be doing more statistical analysis in this period.
I tend to look at the degrees of freedom as just another parameter. The t, chi-square and F distributions can all take df values that are not whole numbers, and so you don’t need to round off to a whole number. Although Excel’s T.DIST, CHISQ.DIST and F.DIST function will indeed round to a whole number, the Real Statistics equivalents, T_DIST, CHISQ_DIST and F_DIST, can use the fractional parts of the dfs.
Charles
Hello Charles, I use Excel 2010. I cannot find F_DIST-RT. Is it necessary to install your Real Statistics Resource Pack before?
F.DIST.RT is a standard Excel function, while F_DIST_RT is a Real Statistics function.
Charles
Hello all,
How to report the Welch’s F test. For example this are the results:
statistic df1 df2 sig
Welch 13,458 1 70,168 ,001
Statistic: 13,458
df1: 1
df2: 70, 168
sig: ,001
John,
Report it the same way you would for one-way Anova.
Charles
Hello Charles,
I have the same question with John. Should I reported the ‘statistic’ as F value, Just like ‘F value: 13,458’ (actually 13,458 is value of ‘statistic’)?
Hello Eva,
You can report the results as described at
http://statistics-help-for-students.com/How_do_I_report_a_1_way_between_subjects_ANOVA_in_APA_style.htm#.XIfAN_ZFzIU
Just use F*instead of F.
Charles
Hi,
If I have 10 Methods data (i.e. 10 columns of data) and when I run Brown-Forsthe test, I get p < 0.05.
This implies the variances varry.
Now, how do I get to know which columns have same variances and which do not?
The Brown-Forsythe F* test (at least the version of the test that I describe on the referenced webpage) is not used to test whether the variances are unequal, but instead is used instead of ANOVA when you already know that the variances are unequal.
In my experience, in this case, you are usually better off using Welch’s ANOVA rather than Brown-Forsythe.
If you get a significant result (p < .05) from Brown-Forsythe (or Welch's ANOVA) the commonly used post-hoc test to identify which means are unequal is the Games-Howell test.
Charles
Hello
what’s the right post hoc test that follows a Brown-Forsythe test when the variances across the different groups are not equal? may i use tukey HSD or should it be Games-Howell (as it is after Welch’s test)?
Ram,
Probably Games-Howell. Why did you decide to use Brown-Forsythe instead of Welch’s test?
Charles
I have a problem with the Games-Howell not showing a significant difference between the groups and hoped i would be able to use tukey- HSD as a post HOC after Brown-Forsythe.
Ram,
You shouldn’t choose the test based on the result that you would like to see.
Charles
thank you very much
I couldn’t find figure 3 in my excel can you help me?
I’m not sure I understand the problem that you are having. Are you saying that you can’t find the Brown-Forsythe data analysis tool on your version of the Excel Real Statistics Resource Pack? What version of the Real Statistics Resource Pack are you using? To find out enter the formula =VER() in any cell.
Charles
Hi Mr. Zaiontz,
Hope you’re doing well. Glad I could be of assistance with the Schierer Ray Hare test for the next release. Regarding the BF test, I have a question. Looking at the way the BF F statistic is calculated, it appears that smaller sample sizes are given larger “weights,” for lack of a better term…the ratio of (1-(group size/total N)) will be larger for smaller groups. If these smaller groups have smaller variances as a whole than the larger groups, it seems that to some extent, the larger weight given to these smaller variances would more or less even out. Conversely, if the smaller groups have the larger variances, wouldn’t that overly inflate the denominator of the F statistic and reduce its value? To me, that would suggest that the BF statistic was being overly conservative in the latter situation (and fairly well on target in the former), but isn’t the Welch F supposed to be generally more accurate (and more conservative) than the BF F statistic with regard to type I error? Am I missing something in my interpretation of the formula? Thanks again for the great work!
Kevin,
I am very pleased that you like the Real Statistics website and software. Thanks again for proposing the Scheirer Ray Hare test. It is now part of the current release.
The situation that is worse for the usual ANOVA is when the smaller groups have the bigger variances. If BF compensates for this then it is probably doing the right thing.
Yes, generally Welch’s test is preferred over the BF test, esp. when the homogeneity of variance assumption is violated.
Charles