Basic Concepts
The Jonckheere-Terpstra test is used instead of the Kruskal-Wallis test when there is an expected order to the group medians. More specifically, the null and alternative hypotheses for this test are:
H0: Mdn1 = Mdn2 = … = Mdnk
H1: Mdn1 ≤ Mdn2 ≤ … ≤ Mdnk where at least one of these ≤ symbols can be replaced by the < symbol.
Here the Mdnj is the population median of the jth group and k > 2.
Note that it is essential that you determine the order of the groups (and the direction of this order) before collecting any data. Also, as for the Kruskal-Wallis test, the sample elements in each group must be collected randomly and independently; also, the group samples are independent of each other (e.g. no participant can appear more than once in a group or appear in more than one group).
As in the Kruskal-Wallis test, we must assume that the group distributions have the same shape and variability (although the magnitude of the values between groups can be different). Otherwise, we cannot make assertions about the medians, but only about the relative order of values between the groups (in a similar manner as we do for Kruskal-Wallis).
Test Steps
The test is carried out as follows:
Step 1: Arrange the sample data in the expected order of the group medians; i.e. the first column contains the data elements with the smallest expected median, the second column contains the data elements with the second smallest expected median, etc. The result is an array of values xij where nj = the number of elements in the jth column and n = the sum of the nj.
Step 2: For each xij with i ≤ nj and j < k, define sij+ as the number of values xrc such that j < c and xij < xrc , and sij as the number of values xrc such that j < c and xij = xrc.
Step 3: Calculate the following:
![]()
![]()
Step 4: For n sufficiently large with each nj not too small (about nj > 8), z is approximately standard normally distributed. Thus, if the p-value < α, the null hypothesis is rejected in favor of the alternative hypothesis. Generally, a one-tailed test is used.
Example
Example 1: A research team wanted to determine whether there was a statistically significant difference between the ability of four common household cleaning ingredients to kill bacteria. They expected that the order from least to most effective was detergent, ammonia, vinegar, and mild bleach. They then ran a series of experiments and counted the percentage of bacteria killed as shown in range B4:E9 of Figure 1. Based on this data, determine whether there is a significant difference between these ingredients.
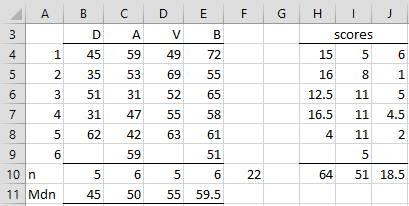
Figure 1 – Jonckheere-Terpstra data and scores
The size of each of the four groups nj is shown in range B10:E10 and the medians in B11:E11. n = 22, as shown in cell F10. The scores sij+ + .5·sij= for each cell in B4:D9 are shown in H4:J9. For example, the value of 15 in cell H4 is calculated via the following formula:
=IF(B4<>””,COUNTIF(C$4:$E$9,”>”&B4)+0.5*COUNTIF(C$4:$E$9,B4),””)
By highlighting H4:J9 and pressing Ctrl-D and Ctrl-R, the scores for the other cells are calculated. The values in range H10:J10 are the sums of the scores for the three groups. The test is now shown in Figure 2.
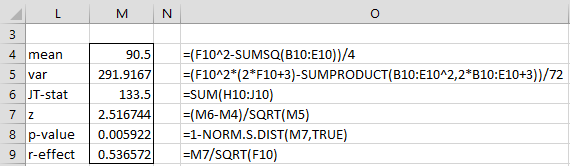
Figure 2 – Jonckheere-Terpstra test
The low p-value shows that there is a significant difference between the four cleaning ingredients.
Effect Size
Also note that r-effect is calculated as for the Mann-Whitney test, namely
r = z/√n = 2.517/√22 =.537
which is generally viewed to be a large effect.
Worksheet Function
Real Statistics Function: The Real Statistics Pack provides the following array function:
JT_TEST(R1, lab) = a column array with the values JT-statistic, z, p-value for the Jonckheere-Terpstra test based on the data in range R1. If lab = TRUE, then a column of labels is appended to the output (default FALSE).
The formula =JT_TEST(A4:E9) will produce the output shown in range L6:M8.
Note that if we had performed the Kruskal-Wallis test instead on the same data, we would have gotten p-value = .0975, which is not significant for α = .05.
Links
Examples Workbook
Click here to download the Excel workbook with the examples described on this webpage.
References
Shan, G., Young, D., and Kang, L. (2014) A new powerful nonparametric rank test for ordered alternative problem. PLoS One
https://journals.plos.org/plosone/article?id=10.1371/journal.pone.0112924
Laerd Statistics (2018) Jonckheere-Terpstra test using SPSS statistics
https://statistics.laerd.com/spss-tutorials/jonckheere-terpstra-test-using-spss-statistics.php
Wikipedia (2018) Jonckheere’s trend test
https://en.wikipedia.org/wiki/Jonckheere%27s_trend_test