Basic Concepts
There are two common measures of effect size used for ANOVA and contrasts: one based on Cohen’s d (see Effect Size for Samples) and the other based on the correlation coefficient r (see Basic Concepts of Correlation). We will cover the first type here and the second type in Other Measures of Effect Size for ANOVA.
For pairwise contrasts, we can use Cohen’s d measure of effect size, namely
![]() which can be implemented using Hodges g measure of effect size, namely
which can be implemented using Hodges g measure of effect size, namely
![]()
This can be extended to the comparison of more complicated contrasts. E.g. for the null hypothesis H0: 
![]()
The interpretation of g is the same as for a comparison of two means.
This measure of effect size can be extended to the omnibus ANOVA. The following measure is called the root-mean-square standardized effect (RMSSE).

In Excel, this can be calculated as
=SQRT(DEVSQ(R1) / ((k–1)*R2)
where R1 is the array of group means and R2 is a cell that contains MSE. The group means differ on average by d standard deviations from the grand mean. E.g. if d = .8, then the group means differ by 80% of a standard deviation from the grand mean, which is a sizable difference.
Interpretation
When no better information is available, a rule of thumb is that d = .10 is a small effect, .25 is a medium effect, and .40 or more is a large effect. To calculate power, you can employ G*Power (available for free on the Internet) using the above values of d. You can also use the capabilities described in Power for One-way ANOVA.
Examples
Example 1: Calculate the effect size d (RMSSE) for the ANOVA in Example 2 of Basic Concepts for ANOVA.
Using the Excel formula given above, d = SQRT(DEVSQ(I7:I10)/(H15*I16)) = .618 (referring to Figure 2 of Basic Concepts for ANOVA), which is quite a high value.
Example 2: Calculate the effect size d (RMSSE) for the ANOVA in Example 3 of Basic Concepts for ANOVA using the One Factor ANOVA data analysis tool.
Figure 1 from Confidence Interval for ANOVA displays the output from the Real Statistics One Factor ANOVA data analysis tool used to perform this analysis. This figure is replicated as follows:

Figure 1 – Effect size from Real Statistics ANOVA data analysis tool
We can see from Figure 1 that the RMSSE effect size is 0.597509 (cell M14). The figure also shows the omega square effect size measurement (cell N14), which is explained in Other Measures of Effect Size for ANOVA.
Cohen’s f
Another related measure of effect size is Cohen’s f, defined as

where 

f = .10 represents a small effect, f = .25 represents a medium effect and f = .40 represents a large effect.
We will use this measure of effect size when we discuss power and sample size requirements (see Power for One-way ANOVA).
Effect size of contrasts
Example 3: Calculate the effect size d for the contrast in Example 4 of Planned Comparisons for ANOVA.
Figure 2 shows the output from the Real Statistics Contrast data analysis tool. In particular, we see that Cohen’s d (cell V39) = ABS(T36)/N39 = 0.39.
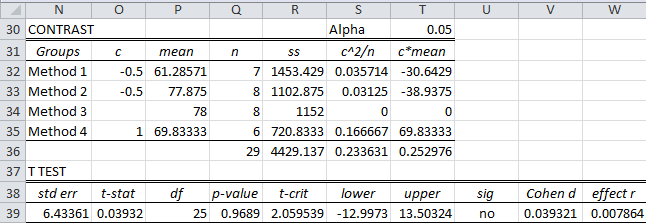
Figure 2 – Effect size from Real Statistics Contrast analysis tool
When you select the Contrast tool, you will be presented with the dialog box shown in Figure 3. You need to select the type of alpha correction that you want, namely no experiment-wise correction, the Bonferroni correction, or the Dunn/Sidák correction (as explained in Planned Comparisons). In any case, you set the alpha value to be the experiment-wise value (defaulting as usual to .05). You also need to make sure the Independent type of contrast is selected (the default).
Note too that the contrast output that results from the tool will not contain any contrasts. You need to fill in the desired contrasts directly in the output (e.g. for Example 3 you need to fill in the range O32:O35 in Figure 2 with the contrasts you desire).
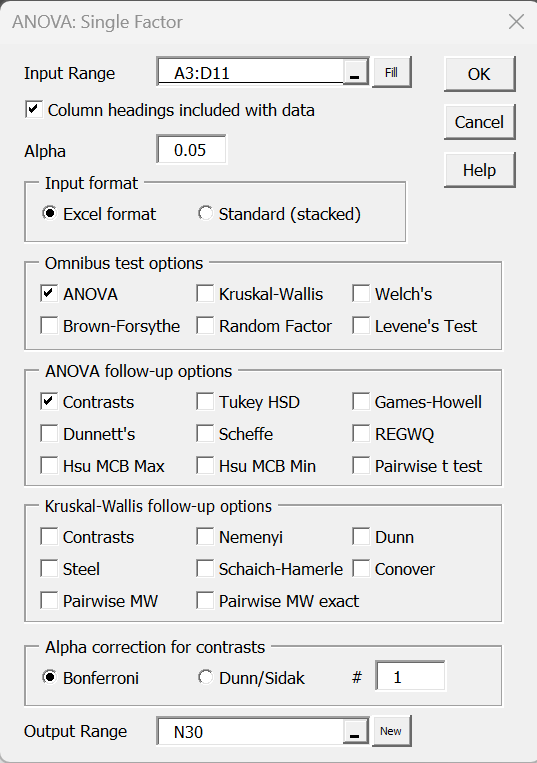
Figure 3 – Dialog box for Contrasts in data analysis tool
Links
Examples Workbook
Click here to download the Excel workbook with the examples described on this webpage.
References
Zhang, G., Algina, J. (2011) A robust root mean square standardized effect size in one-way fixed-effects ANOVA
https://digitalcommons.wayne.edu/cgi/viewcontent.cgi?article=1290&context=jmasm
Wuensch, K. (2023) Cohen’s d, Cohen’s f, and η2
No longer available online
Lakens, D. (2013) Calculating and reporting effect sizes to facilitate cumulative science: a practical primer for t-tests and ANOVAs
https://www.frontiersin.org/journals/psychology/articles/10.3389/fpsyg.2013.00863/full
Charles,
It’s not clear to me how effect size and significance are used in interpreting data. For example the data in Fig. 1 show a large effect by RMSSE, Omega-sq, and Eta-sq, but the P-value is not significant. Can we say there is an important difference between the Methods?
Thanks,
Hi Dave,
Yes, you can say there is an important difference between the methods based on the sample collected.
Effect size provides a way to quantify the size of the effect based on the data collected.
The p-value provides a way to determine whether the results from a sample can be generalized to the general population.
Charles
That makes sense. I will include both the effect size and p-value in ANOVA interpretations.
Dear Dr. Zaionts,
Perhaps of interest. I think Cohen actually also lists a Cohen d for a one-way ANOVA. Equation 8.2.5 (p. 276) is d = (m_max – m_min)/sigma. Where sigma is the common standard deviation (i.e. the within-population sd).
The version of Cohen’s d for independent labels, Cohen seems to list as ‘d_s’ (equation 2.5.1 p. 66), and the one for a one-sample as ‘d’ ‘(equation 2.3.3. p. 46).
Sigh, all these are often referred to as ‘Cohen d’ but might be good to label each slightly different.
Hello Peter,
Thanks for sharing this. What book or paper are you referencing regarding Equation 8.2.5?
The Real Statistics webpage uses RMSSE as a version of Cohen’s d, but the results are quite different from those obtained via the formula you are referencing. E.g. for Example 1, RMSSE = .618, but your formula yields d = 1.316 (if I have understood correctly). For Example 2, RMSSE = .598, while your formula yields d = 1.256.
Charles
The references are from the book from Cohen:
Cohen, J. (1988). Statistical power analysis for the behavioral sciences (2nd ed.). L. Erlbaum Associates.
It indeed is an entirely different result. The RMSSE you are using is most likely taken from:
Steiger, J. H., & Fouladi, R. T. (1997). Noncentrality interval estimation and the evaluation of statistical models. In L. L. Harlow, S. A. Mulaik, & J. H. Steiger, What if there were no significance tests? (pp. 221–257). Lawrence Erlbaum Associates.
For example 1 Cohen’s d = (78 – 61.28571)/sqrt(177.165) = 1.255738.
Thank you very much, Peter.
I will look at Cohen’s book.
Charles
Peter,
I think that I overlooked your last question. If there is no significant result, you still can use the effect size.
Charles
Hello,
I am attempting to calculate effect sizes for one-way ANOVA using your instructions.
What is the number in Figure 1. shown in cell I16? It is in the MS column under 464.72 and 117.16. The number in cell I16 is referenced in this formula SQRT(DEVSQ(I7:I10)/(H15*I16)). Excel tables for for one-way ANOVA do not show a number in that space. I am also using XLStat to run one-way ANOVA and that also does not show a number in that space.
Also can effect size be calculated for two-way ANOVA or for a repeated measures ANOVA?
Thank you very much for your assistance in advance.
Best,
Mike
Hello Mike,
1. Cell I16 contains the value 207.975. It is calculated by the formula =G16/H16. Value in cell I16 is not very important and is never used.
2. For the effect size of Two-way ANOVA see the partial eta-square effect size in Figure 3 of
https://www.real-statistics.com/two-way-anova/real-statistics-support-for-two-factor-anova/
3, For the effect size for Repeated Measures ANOVA see the partial eta-squared effect size in Figure 2 of
https://www.real-statistics.com/anova-repeated-measures/repeated-measures-anova-tool/
Charles
Thank you Dr. Zaiontz. Do you consider that η2 is an accepted way of calculating effect size in one-way ANOVA and if yes, what is its mathematical relationship with RMSSE (if any)?
Hello Kelly,
1. Yes, (partial) eta-square is an acceptable way of calculating the effect size.
2. Suppose that n = the sample size, k = # of groups, e = (partial) eta-square and r = RMSSE. I believe that ((n-k)*e)/(1-e) = r^2*n*(k-1)/k
Charles
Kelly,
Now I understand your question better about eta-square. It is a commonly used estimate of effect size, but it is a biased estimate of the population’s coefficient of determination and so omega-square is a better estimate.
Charles
Τhank you very much!
Dear Dr. Zaionts,
May I ask how to calculate effect size from F statistics of two-way ANOVAs if all you have is the result (e.g. F(2, 33)=4.08)?
Thanks a lot.
Sheree
I don’t know of any way to calculate the effect size(s) without additional information. It probably can’t be done.
Charles
Dear Professor,
The “RMSSE” is the same “Steiger’s ψ”?
I find this effect here: http://www.biochemia-medica.com/2016/2/150
Say is equal, but I can do some mistake.
Thanks
José
Jose,
I am not familiar with the term Steiger’s ψ, but from the little research I have just done it does seem identical to RMSSE.
Charles
Hello, I am trying to figure out how to calculate effect size after conducting a Welch’s ANOVA? Which numbers should I use for the formula? I have found out that for regular ANOVA I should use sum of squares between groups and total sum of squares but Welch’s ANOVA does not contain those values.
Best regards,
Mia
Mia,
It’s a good question, but I don’t know any commonly used measure of effect size for Welch’s ANOVA.
Charles
Hi Mia,
Even I had to face the same problem. I couldn’t seem to find any valid test for effect size assessment. However, I recently stumbled upon this handout
http://oak.ucc.nau.edu/rh232/courses/EPS625/Handouts/One-Way%20ANOVA/ANOVA%20-%20Example%20-%20Welch%20and%20G-H%20-%20Key.pdf
It provides a simple formula to calculate adjusted omega squared, which is supposedly the best alternative to assess effect size when using Welch’s F test.
There is no reference for the formula, though.
Dear Mr. Zaiontz,
Just stumbled upon this and looking at the article you link to it seems they use partial omega squared. The formula is the same as the one from Caroll and Nordholm (1975, p. 547) just written slightly different. A nice post on it can be found at http://daniellakens.blogspot.com/2015/06/why-you-should-use-omega-squared.html who also changes the formula a little (but end result still the same).
Reference:
Carroll, R. M., & Nordholm, L. A. (1975). Sampling Characteristics of Kelley’s ε and Hays’ ω. Educational and Psychological Measurement, 35(3), 541–554. https://doi.org/10.1177/001316447503500304
Dear Peter,
Thank you for sharing this with us. I have just added the two references you cited to the following webpage
https://www.real-statistics.com/multiple-regression/other-measures-effect-size-anova/
Charles
Dear Dr. Zaionts,
This is Gerardo Ardila Duarte. First of all, I would like to apologise again because maybe you did not understand my last email. I would like you to know that my native language is not English but Spanish, and I hardly ever write in English.
Now let me tell you what I would like to know. In the university I work for in the field of research, I ask students to make a sample pilot which must be at random and whose size must be five as a mimimum. The main purpose of this for me is to check what the sampling error is and based on it, I do the calculations of the size of the sample. I would like to know what your opinion is about my work. I mean, is this size advisable for the sample pilot? Or would you suggest me to take a different size instead? What procedure would you recommend to me?
I would really appreciate your valuable comments and suggestions.
Cordially yours,
GAD
Since the sample is so small, I am not sure what you will learn from the sampling error. I can think of a lot of reasons for doing a small pilot: experience in creating the sample, testing any questionnaires, checking whether the procedures used work in the real world, etc. But you would need a larger sample to really check anything related to the mathematical part of the design.
If your goals are of the type listed above, then even a sample of size 5 could be appropriate, but for more meaningful statistical results you would usually need a bigger sample. The actual sample size depends on the specific test you are planning to use and the effect size you need to detect with your analysis. These topics are reviewed in a number of places on the website related to Sample Size Requirements. You can enter these words in the Search box and read more about this topic.
Charles
Thank you very much
Dr. good afternoon, for research on, to determine the sampling error I ask students a pilot minimum five size test, not whether it is doing correctly, I have done as tables student and the problems that I see they are of minimum size five, there is a criterion that I report that the sample size should I use for a pilot ?, is that the calculation of the size of the pilot is not required, just want to know who would use size for a pilot, and not even commit a serious error in determining the sample size, I am very grateful to its magnificent page.
Thanks a lot
Gerardo,
Sorry, but I don’t understand your question (probably since English is not your native language). A key question for you is “what is the objective of the pilot?” Depending on your answer perhaps the sample size is not important.
Charles
Excusme Dr. english is not my lenguaje.
Dr. good afternoon, in order to doing research, and determine the sample size, I ask students a minimum pilot five size test, in order to determine the sampling error and/or effect size, I am not sure whether it is doing correctly. Do you know There is a criterion that I report that the sample size should I use for a pilot ?
Thanks a lot
Gerard,
I know that it can be difficult to express yourself in another language (I need to do this everyday), but unfortunately I don’t understand your question well enough to be able to answer it.
Charles
Dear Dr. Zaionts,
This is Gerardo Ardila Duarte. First of all, I would like to apologise again because maybe you did not understand my last email. I would like you to know that my native language is not English but Spanish, and I hardly ever write in English.
Now let me tell you what I would like to know. In the university I work for in the field of research, I ask students to make a sample pilot which must be at random and whose size must be five as a mimimum. The main purpose of this for me is to check what the sampling error is and based on it, I do the calculations of the size of the sample. I would like to know what your opinion is about my work. I mean, is this size advisable for the sample pilot? Or would you suggest me to take a different size instead? What procedure would you recommend to me?
I would really appreciate your valuable comments and suggestions.
Cordially yours,
GAD