Basic Concepts
When the homogeneity of variances assumption is not met, especially with unequal sample sizes, Welch’s Test is a good choice for performing an ANOVA analysis.
Property 1: If F is defined as follows:
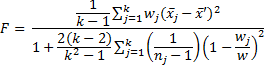 where
where
![]()
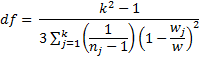
then
![]() where
where
 Example
Example 1: Repeat Example 1 of Kruskal-Wallis using the data in range E19:G29 of Figure 1 by performing Welch’s Test.
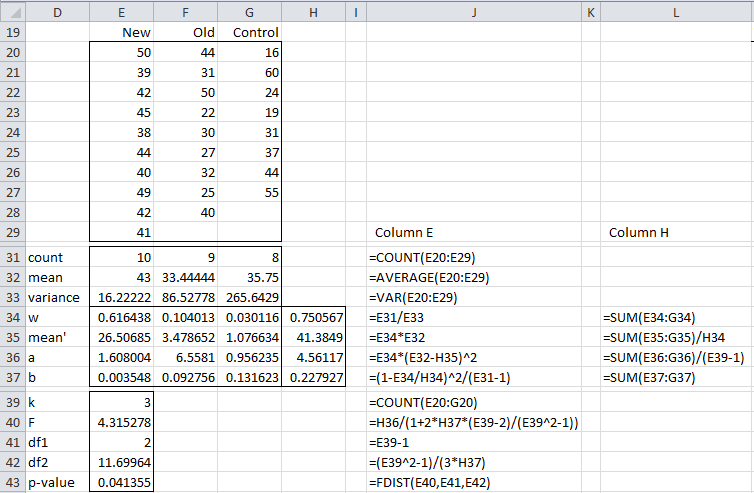
Figure 1 – Welch’s Test
We see from row 33 of Figure 1 that the variances of the three groups are 16.2, 86.5, and 265.6, and so we suspect there is a significant difference between the variances. This is confirmed by using Levene’s test (on the medians) since Levene(E20:G29,1) = 0.005478. Thus, the normal one-way ANOVA is not the correct test to use. We employ Welch’s test instead, as shown in Figure 1.
We see from Figure 1 that the p-value = .041355 < .05 = α, and so we conclude that there is a significant difference between the means of the three groups.
Note that if we had used ANOVA (see Figure 2), we would have come to a completely different conclusion (since p-value = .14 > .05 = α).
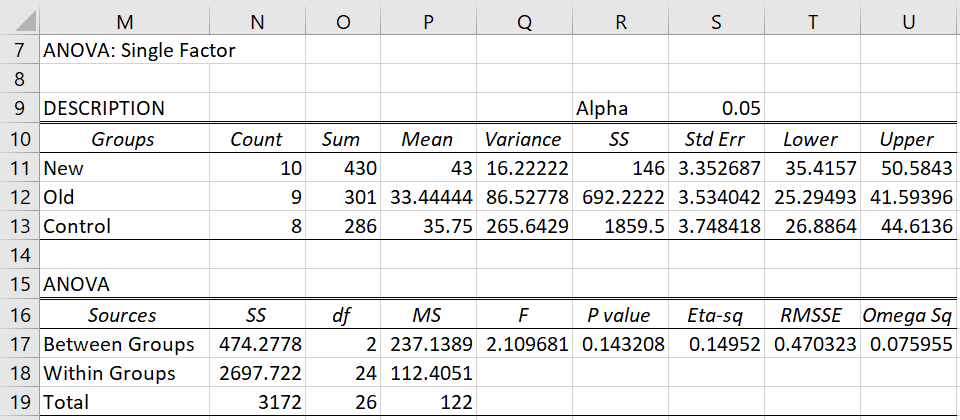
Figure 2 – ANOVA on the same data
Worksheet Function
Real Statistics Function: The Real Statistics Resource Pack contains the following array function where R1 is the data without headings, organized by columns:
WELCH_TEST(R1, lab): outputs a column range with the values F, df1, df2, and p-value for Welch’s test for the data in range R1.
If lab = TRUE, a column of labels is added to the output, while if lab = FALSE (default), no labels are added.
For Example 1, the result of WELCH_TEST(E20:G29, TRUE) is similar to range D40:E43 of Figure 1. The main difference is that this function uses the Real Statistics F_DIST function instead of the Excel function F.DIST (or FDIST) to calculate the p-value and so obtains a more accurate result.
Data Analysis Tool
Real Statistics Data Analysis Tool: The Real Statistics Resource Pack provides access to Welch’s test via the One Factor Anova data analysis tool, as described in the following example.
Example 2: Repeat Example 1 using the Real Statistics data analysis tool.
Press Ctrl-m, and select the One Factor Anova option from the Anova tab (or from the dialog box that appears after selecting the Analysis of Variance option if using the original user interface). Now fill in the dialog box that appears as shown in Figure 3.
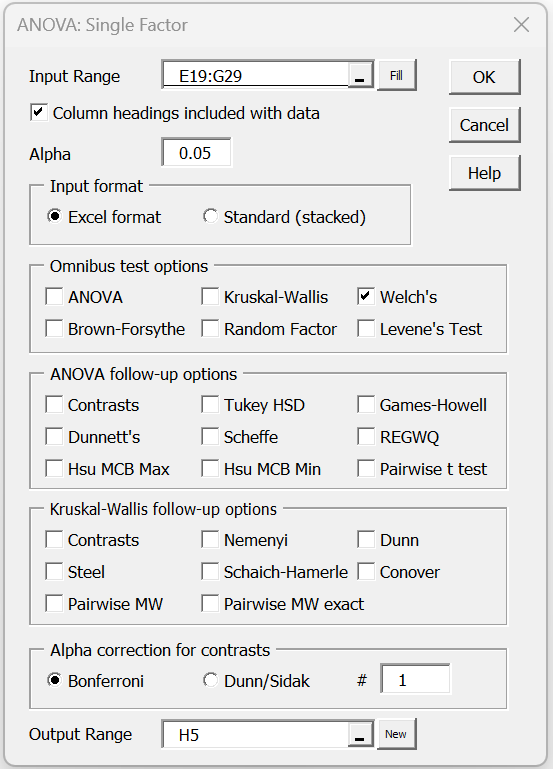
Figure 3 – Dialog box for Welch’s data analysis tool
The output is shown in Figure 4.

Figure 4 – Welch’s test data analysis tool
Note that the results shown in Figure 4 agree with those in Figure 1 except that the p-value is slightly lower. The reason for this is that Figure 1 uses the worksheet formula = FDIST(E40, E41, E42), which is equivalent to the formula =1–F.DIST(E40,E41,E42, TRUE). Both of these formulas truncate the value in E42 down to an integer value, i.e. to =FDIST(4.315278,2,11). The calculation in Figure 4 is more exact and uses F_DIST instead of F.DIST, and so the full value of df2 = 11.69964 is used.
Standard (stacked) Format
As can be seen from Figure 3, data for Welch’s test can be organized in standard format. The first 10 of the 27 rows of the data for Example 1 in standard format is shown in Figure 5.

Figure 5 – Data in standard format
Links
Examples Workbook
Click here to download the Excel workbook with the examples described on this webpage.
References
Howell, D. C. (2010) Statistical methods for psychology (7th ed.). Wadsworth, Cengage Learning.
https://labs.la.utexas.edu/gilden/files/2016/05/Statistics-Text.pdf
Delcre, M., Levs, C., Mora, Y., Lakens, D. (2019) Taking parametric assumptions seriously: Arguments for the use of Welch’s F-test instead of the classical F-test in one-way ANOVA
https://pure.tue.nl/ws/portalfiles/portal/143487258/198_2046_1_PB.pdf
GraphPad (2024) Interpreting results: Welch and Brown-Forsythe tests
https://www.graphpad.com/guides/prism/latest/statistics/interpreting_welch_browne-forsythe_tests.htm
Hi Charles! so, since my homogeneity is less than 0.05, i used the Welch’s ANOVA test as the alternative test, and the result is 0,017. But when i run the Post-Hoc Games-Hendalll Test, there isn’t even one pair of group who are significantly different.. which means they cannot detect or see which pair is significantly different… what should i do about it? why this happened? if i were to conclude this in my report, should i say there is no significant difference among thr groups or say there is but not big enough for the program to tell? thank you!
Hello,
I assume that you are using the Games-Howell post-hoc test. Let me know if I got this wrong.
It is quite possible that you get a significant result for an omnibus test such as Welch’s ANOVA but no significant comparison test. These are different tests, and so can yield contradictory results. I would report the omnibus test result, state that there is no significant pairwise comparison and finally state the pairwise comparison that is closest to significant.
If the omnibus results are very far from the pairwise p-values, then I would check to make sure that you din’t make a mistake in one of these tests.
Charles
Dear Charles,
My dataset has three groups to test and they are all normally distributed but the variances are unequal (tested witk Shapiro-Wilk and Leve’s tests respectively). Therfore, I choosed to procee with Welch’s ANOVA test followed by the post hoc test Games-Howell. I used your add-inn RealStatistics.
My question is: do I need to adjust the alpha in the Games-Howell test? I see in the print result of the Games-Howell test that the alpha (top right) is 0.05. as below:
GAMES HOWELL alpha 0.05
————————————————————
group mean size variance
0-2cm 391619562.7 6 2.83532E+16
10-15cm 36348213.7 6 4.8824E+13
20-25cm 23591898.45 6 2.31794E+13
Also I do not have the option of choosing no correction in the last section of the One-way ANOVA tab. Wha I choose os Welch’s , then Games-Howell, then Bonferroni but I leave the #to 1 (I also tried to change it to 3 as I have 3 groups but the results does not change) and the alpha printed with the GAMES-Howell test is still 0.05.
Do you have any suggestion on how to proceed?
Thank you and BEst Regards,
Valentina
Hello Valentina,
You don’t need to adjust alpha when you use Games-Howell. In this case, the # is ignored.
Charles
Mr Zaiontz, thanks for your job
I’m working with three unbalanced groups for comparison. Data shows non normality (Shapiro Wilk) and Heteroscedasticity (Levene).
My first approach was Kruskal Wallis, then Welch ANOVA Test. I’d like to include a report with the power of the hypothesis test.
I’d appreciate any suggestion.
Hello Mauricio,
If the data is non-normal per Shapiro-Wilk, but passes Levene’s test for homogeneity of variances, then Kruskal-Wallis is probably a good choice. If the data doesn’t pass Levene’s test, then probably Welch ANOVA is the better choice. If the data is heavily skewed, then you might be better off using Resampling or a modified version of Welch’s ANOVA as described at
https://www.researchgate.net/publication/288728293_Tests_for_Treatment_Group_Equality_When_Data_are_Nonnormal_and_Heteroscedastic
I don’t know how to calculate the power of Welch’s ANOVA.
To report the results from Welch’s ANOVA, I would use the same approach as for one-way ANOVA but explain why you didn’t use one-way ANOVA. A possible estimate of the effect size is shown at
https://docplayer.net/40472546-Eps-625-intermediate-statistics-one-way-anova-in-class-example-adjusting-for-heterogeneity-of-variance.html
All of these tests are described on the Real Statistics website and supported by the Real Statistics software.
Charles
Thanks for your quick reply and gentle suggestion. I’ll work with Welch ANOVA because my data show Heterokedasticity and small departures from normality.
Thanks for the papers. Below I share another article in relation to power for Welch’s test that could be interesting for you.
Show-Li Jan and Gwowen Shieh. 2014. Sample size determinations for Welch’s test in one-way heteroscedastic ANOVA. British Journal of Mathematical and Statistical Psychology, 67, 72–93
Best regards,
Hi, Mr.Zaiontz
I have a question. Is it possible to use omega-squared as a measure of effect size after Welch’s ANOVA? This measure is based on sum of squares from ANOVA table, where equal variances are assumed. What is your advice?
Thank you!
Hi Anna,
If you use the ANOVA omega-squared effect size statistic, I would clearly label it as such.
I found the following measure of effect size that may be helpful.
http://oak.ucc.nau.edu/rh232/courses/EPS625/Handouts/One-Way%20ANOVA/ANOVA%20-%20Example%20-%20Welch%20and%20G-H%20-%20Key.pdf
Charles
Thank you very much!
Hello SIr
first of all, I want to appreciate the addin develop by you for statistical evaluation for researchers.
I have one question in my mind. I have an unequal sample size of 15, 42, 12, 6 and 13. The variance in the data is equal. So let me know that can i go for ANOVA as such or welch ANOVA.
You should use ANOVA.
Charles
You should use ANOVA.
Charles
Hi Charles,
In the formula row 40 you do : k-2. Does that mean that the Welch’s ANOVA does not apply to the two sample case ?
Thanks you
My mistakes, I forgot the +1 in the formule.
Dear Charles,
is it also possible to analyze data of a different Format?
Group 1 | Group 2
2,43432|3,34244
4,32542|5,32424
………….|…………
Best regards,
Daniel
Daniel,
This seems to be the usual format.
Are there only two groups? If so, then you can use the usual two sample t test with unequal variances.
Charles
Thanks, Charles.
Hello
I want to analyze my project that contains 2years, 4locations, 10 treatments in 3 replications. But, the variances are not equal. What do I do? How do I analyze it by B-F or Welch methods?
I could not download figure of your examples.
Thanks
Zahra,
Welch’s ANOVA can be used for one-way ANOVA when the equal variances assumption is not met, but your scenario is more complicated than one-way ANOVA. One approach that might be useful for you is to use resampling. This is explained on the website for the one-way ANOVA case, but can be extended to more complicated ANOVA scenarios.
Charles
Dear Charles,
I am performing a Welch’s ANOVA and Games Howell post-hoc test. The latter does not enter anything under “c”, and calculations below refer to other empty cells (what is “c”?). This occurs for both the MS Excel 2003 and 2007 versions.
In the Mac version, I get the message “Compile error in hidden module: AnovaAnalysis”
Is there a fix for either of these issues?
Many thanks,
Matt
Matt,
1. The c column you need to insert the contrast coefficients as described on the Unplanned Comparisons webpage. You put a +1 and -1 in the rows corresponding to the two variables you want to compare.
2. The usual reason for the error message is that Solver has not been activated. Select Addins from the Tools menu. Solver should appear on the list of addins with a check mark next to it.
Charles
Dear Charles,
Homogeneity of variance was violated so I ran Welch ANOVA and found p-value of .05 for DV ‘X’.
1) Is it possible to run ANCOVA using Welch test in SPSS?
2) I want to run a mediation analysis using ‘X’ as a mediator. Is there any method you may recommend?
Thank you
Sarah,
1. I don’t use SPSS and so I can’t answer this question.
2. Please explain what you want to accomplish with the mediation analysis.
Charles
Hi Dr. Zaiontz,
I have a question on the critical values of the F-distribution and their implications for Welch ANOVA. It seems that the denominator degrees of freedom for the Welch version are always less than the corresponding standard ANOVA, although I’m not sure how that could be proved. Less degrees of freedom would imply to me that there is less “information” conveyed as far as the numbers contained in the system, and since we have less information, we would want to “hedge our bets” and make our critical value higher to protect against falsely claiming that there is evidence of a difference. So the critical value should be higher for a lower denominator DF…which it is, at least when keeping the numerator DF constant. But is my thinking process an accurate way of explaining why this is so? This would also mean that the Welch test is on the conservative side, protecting against a type I error at the expense of power, am I correct?
I’ve seen the process for determining the power of a Welch ANOVA (and it’s not pretty, believe me!), and generally the result falls very close to the power of a standard ANOVA assuming the sample sizes are adequately large. I’ve even seen some statisticians advocate for using Welch ANOVA by default, since it protects against type I error if your variances are different, and if they aren’t, the difference in power usually isn’t enough to make much of a difference anyway. Do you have thoughts on this?
Thanks again for all the work you do on the site!
Kevin,
I have not really thought about this issue and so can’t say whether or not what you are saying is correct. What you are saying does seem reasonable, but I have no evidence as to whether this is correct or not.
Charles
Hello
What happens if I have outliers? My data is normal and non homogeneous.
Thanks
Valerie,
First things first. Are these outliers representative of what is really going on or are they errors (typing mistakes, poor instrument readings, etc.)? Also how far away from the mean/median are they (a little out of what is expect or a lot)?
One approach to dealing with outliers is to a test which is more forgiving of outliers (e.g. Krusal-Wallis since it uses ranks) or to run the test twice: once with the outliers and one without and report both results. You can also use bootstrapping techniques.
Charles
Hi Charles,
I’ve encountered a bit of a problem. I need to run Welch’s and Games-Howell on my data. Because I use a Mac, I’ve had to do this on a Windows computer in another area of our campus. I saved the Excel file after doing so, but when I open the file on my Mac I get a linking error. In the Welch’s and Games-Howell results boxes I get this sort of thing in the formula bar in front of certain formulas: AppData/Roaming/Microsoft/AddIns/RealStats.xlam’!QCRIT(COUNT(X3:X5),W9,Y1,2). It’s obviously trying to refer back to the computer on which I ran the analyses.
Any solution for this?
Best wishes,
Jeff
Hi Jeff,
If you have the Real Statistics software installed on the Mac, all you need to do is erase AppData/Roaming/Microsoft/AddIns/RealStats.xlam’! so that the formula becomes =QCRIT(COUNT(X3:X5),W9,Y1,2).
You can also use Excel’s Replace capbility (found at Home>Editing|Find&Select) to replace all instances of the string “AppData/Roaming/Microsoft/AddIns/RealStats.xlam’!” by blank
Charles
Worked perfectly! Wonderful, Charles. Thanks so much.
Jeff
Charles,
I really like your package. I use it on Mac. A few months ago I did some analyses that required Welch’s ANOVA with Games-Howell and Levene’s testing. However, today I cannot do that as the options are not available in the dialogue window. Have you changed the Mac version? (Or, has Excel changed so yours doesn’t work the way it used to?)
Charles,
Apologies. I saw an answer you gave to another user in a different topic that says the Mac version works differently than the Windows version. I have the output I got earlier in my spreadsheet, so I must have done it on a Windows computer.
Best wishes,
Jeff
Hello,
I have three groups of data with the same sample size.
What should I use to analyze? Welch’s or Kruskal–Wallis’s?
Thank you
Bee,
It depends on what hypothesis you want to test and which assumptions (especially, normality and homogeneity of variances) are met.
Charles
Charles,
In figure 1, you show a p-value of 0.041355 based on the formulas in Excel.
In figure 4, the output from using your add-in shows a p-value of 0.039466. This is confirmed by running the same one-way anova (with Welch) in Minitab.
Can you help explain why the p-value in figure 1 is different than what your add-in and Minitab return?
The results shown in Figure 4 agrees with those in Figure 1 except that the p-value is slightly lower. The reason for this is that Figure 1 uses the formula = FDIST(E40, E41, E42), which is equivalent to =1–F.DIST(E40,E41,E42,TRUE). Both of these formulas truncate the value in E42 down to an integer value, i.e. to =FDIST(4.315278,2,11). The calculation in Figure 4 is more exact and uses the Real Statistics function F_DIST instead of the Excel function F.DIST and so the full value of df2 = 11.69964 is used in the calculation.
Charles
Hi Charles,
with your example I can see that there is a significantly difference between the three groups New, Old and Control. But, how can I investigate the difference in pairwise comparisons? Like New compare to Old and Old compare to Control and New compare to Control. Is it the Games Howell the follow up test to be used after Welch’s? Alternatively, is it correct to do the Welch’s Test in two groups per time? First New-Old, then Old-Control and then New-Control, for example.
And in the case my data don’t respect both the homoscedasticity and the normality assumption, is it good to use the Welch’s Test or is it to prefer the Kruskal-Wallis?
Thank you very much.
Asinar,
1. You can follow up Welch’s Anova with multiple Welch’s t tests, but this will increase the experimentwise error, which you can compensate for by using a Bonferroni correction factor. Games-Howell is a commonly used post-hoc test, which automatically takes care of experimentwise error.
2. Kruskal-Wallis requires homoscedasticity and Welch’s requires normality. If the data is close to normality use Welch’s. If both assumptions are strongly violated then the only approach that I know is resampling, which is explained on the website.
Charles
IN ANOVA TEST IF levene’s test was 0.05 what should we do?
1) we continue the test normaly and we use Tukey’s value in our report
2) we stop the report and we write: ANOVA TEST CAN’T BE DONE”!!!
As usual this is a judgement call. I wouldn’t say that if p-value = .051 then use ANOVA, but if p-value = .049 then don’t use ANOVA. Most likely I would use ANOVA and point out that the homogeneity of variance assumption may be marginal.
Charles
Hi Charles,
Beautiful work!
I now understand the process of calculating the Welch ANOVA. I wonder what is the difference between the result from Welch ANOVA and general linear regression (GLR) model. In the variance matrix in the general linear regression model, I assume that the covariance terms are zero and the variances are different for each group. I think this GLR model should be equivalent with Welch ANOVA. But I get different p value from them. Do you know the reason?
Hi Sili,
I have never investigated this, but I don’t think Welch’s ANOVA is equivalent to GLR, and so it is not surprising that the p-values are different.
Charles
Guys, homogeneity of variances almost never happens in real data if we speak about economics/social sciences. So no need to test it, cause 90% chance you’ll find your variances are not equal.
Just always proceed with Cramer-Welch’s / non-parametric…
Dear Charles,
I have one question for you if that’s ok. I don’t have extended knowledge and hence comprehension of statistics, but still I’m trying to find my way with it for my current Master thesis. I tried to do a Factorial Anova, but Levene’s test showed to be non-significant. I then tried via an ANOVA to check for Welch and Brown-Forsythe. Both show non-significant as well. I can’t seem to find any explanation of what this actually means (whether this is good or bad), and what should/can be done as a result. Is there any way I could send you my data and explain what it is I’m trying to check? Maybe that would be easier for you to advise me. I leave it up to you, but thank you for attention in any case!
Thanks and kind regards,
Alexandra
Alexandra,
You can send your data in the form of an Excel file to the email address listed at Contact Us.
Charles
In Excel, the function ‘t-test’ allows you to perform a wWelch corrected test, just type ‘3’ where the formula requires ‘type’ .
Hello,
I originally conducted a one-way ANOVA between 3 separate groups, but found that equality for variance was not met -does that mean I need to run a Welch test instead?
Thanks,
Valerie
Valerie,
Welch’s test is usually chosen in this case.
Charles
Dear Charles
thanks again for the amazing job you have been doing, you are helping of hundreds, maybe thousands of people like me.
My question is, when you said “I believe that Welch’s is not so good with skewed data” above, do you think you can supply the reference for that please. I am using the same argument but cant find anything to backup my argument.
Many thanks
Hamid,
The only reference I was able to find is the following:
https://books.google.it/books?id=xWENVdl6D0YC&pg=PA380&lpg=PA380&dq=Welch%27s+anova+skewed+data&source=bl&ots=pZSSn1ISWE&sig=KG13qsmnlnuXpyrs9JhPM55sSv0&hl=en&sa=X&ved=0ahUKEwji_rj2ivXJAhVMCBoKHejCBGg4ChDoAQhgMAw
I dropped this comment from the Welch’s webpage, because I couldn’t find a definitive conclusion about this issue, but the above reference may be helpful.
Charles
My results show that homogeneity of variances is not met. My question is using the Games -Howell recommended i can’t see any significant difference between the groups. I have a sample sample size (3) and its the same for all the groups. The mean of the groups look different.
What is wrong ?
Thank you.
Are you saying that Welch’s test shows there is a significant difference between the groups, but based on Games-Howell there is no significant difference between the groups? If you send me an Excel file with your data and the tests that you have performed I will try to figure out what is going on. See Contact Us for my email address.
Charles
Hi Mr. Zaiontz,
I understand how to actually perform the Welch ANOVA, thanks to the clear instructions given here. I do like to understand what goes on “under the hood,” so to speak, and I have yet to find any easy to understand info that explains exactly how the Welch test “works.” If the “weight” for each group is defined as the (group size/group variance), then Based on the calculations, I can see the numerator of Welch’s F being sort of a “weighted average” of the total variance, more or less. What in the world does the denominator of the Welch F ratio represent? I think I read somewhere that the denominator was somewhat equivalent to a correction factor based on the “expected value” of the variance, or something similar. Do you have any ideas about what the denominator might represent, and if it is related to the numerator seeming to be a kind of weighted average? Thanks for any insight!
Hi Kevin,
Sorry, but I haven’t had the time to research how the denominator was derived, but you can look at the original paper, which you can find online.
Welch, B.L. (1951) On the comparison of several mean values: an alternative approach. Biometrika.
Charles
Thank you, sir! After looking at that paper, I’m a bit sorry I asked…looks like what’s going on involves just a little more calculus than I took in college! I have a whole new respect for the people like Welch who figured these things out for the rest of us!
Hello Charles,
Thank you so much for this article. However, even with my Data Analysis Tool pack add in on, Figure 3 shows that there is an ‘option’ window where one can select a Welchs Test. I am not able to do this in the most current version of excel. I tried downloading and installing the add-in provided by this site, but I’m having problems. Any advice or help is greatly appreciated.
Welch’s Test is not part of Excel’s Data Analysis Toolpak. You need to install the Real Statistics Resource Pack to use Welsh’s Test.
You said “I tried downloading and installing the add-in provided by this site, but I’m having problems”. What sort of problems are you having?
Charles
Hello Charles,
Thank you so much for publishing this article. However, when I activate the data analysis pack add in, to run a one way ANOVA I don’t see all the options as shown in Figure 3. I cant choose Welch’s vs. Scheffe vs. ect. Is there a different add-in I need to use? I have the most current version of MSO.
Thanks
Welch’s Test is not part of Excel’s Data Analysis Toolpak. You need to install the Real Statistics Resource Pack to use Welsh’s Test.
What is cutoof P-value in levene test in One way Anova, does it depend on the sample size
what about variance ratio ,when it used.
Generally a p-value of .05 is used.
Charles
Dear Dr Zaiontz.
I am not sure if my question is correct in this area.
I have data from three different groups and I would like to know if there are significant differences between each group.
Could you show me the correct test that I have to aply if my data are not normaliced.
Thank you very much and congratulations for your website.
The usual test to use to determine whether there is a significant difference between three groups is ANOVA, provided the assumptions for this test are met.
Charles
Hi Charles,
I love the work you have put into this site!
I am trying to do post tests following a Welch’s ANOVA (my data has unequal variances). Do you recommend Games-Howell following a Welch’s ANOVA? Over a Dunnett’s? In the past I have used a Dunnett’s, which I think doesn’t require an additional familywise error correction, but if I use a Games-Howell, do I need an additional correction for family wise error?
If I want to correct for family wise error, do I need to change the alpha value in the table? I think the software makes the correction automatically for the contrast method, but not for the Games-Howell. I realize I can adjust the “alpha” value in the Games-Howell table to make my p cut off more stringent, but would you suggest I use a Bonferroni correction or is there something other correction I should use, especially if I am only comparing each group to control?
Thank you,
Tara
Tara,
Generally Games-Howell would be my recommendation after Welch’s test. Games-Howell corrects for familywise error and so no additional correction factor is needed.
Charles
What if I need to run a two way ANOVA but my HOV is violated? I believe the Welch is only for one way, is that correct?
Thank you!
Melanie,
Welch is only one-way. I don’t know of any two-way test, although some sort of bootstrap approach might work. I saw on the Internet the following articles as well:
http://sites.stat.psu.edu/~mga/papers/akr.jasa.90/rt.jasa.90.pdf
Some seem to normalize the ranks of the data, using a formula such as NORMSINV((r-3/8)/(n+1/4)) where nn= the sample size and r = the rank of the ith element, and then use some other technique.
Charles
Thank you Charles! Very much appreciated.
Thank you very much for putting up a very informative site…
I would really appreciate it if you could help me on this one. For the data set I’m working on, I used the Welsch’s test since the p value of the means after performing Levene’s test was less than 0.05 and after transforming the data to log, the p value of the means after performing Levene’s test was still less than 0.05. Were my procedures correct? Also, is the Games Howell Test applicable as the post-hoc test for Welch’s test, specifically the since the data I’m working on have unequal sample size? Thanks very much.
Eliza,
Your procedures seem correct to me. Some might use an alpha value less than .05 for Levene’s test, but the approach you used (alpha = .05) is generally the one people use. Games Howell is generally a good choice after Welch’s test.
Charles
Are all post hoc tests allowed to use after Welch’s test? E.g. Tukey’s multiple comparisons?
Rose,
No. If your motivation for using Welch’s test was lack of homogeneity of variances, then this problem also impacts most of the post hoc tests. Games Howell could be used since it doesn’t assume that the variances are equal.
Charles