Our goal is to estimate a confidence interval for the noncentrality parameter and, in turn, the RMSSE effect size and statistical power of one-factor ANOVA. To do this, we use the approach described in Confidence Intervals for Power and Effect Size of t Tests to calculate a confidence interval for the effect size or statistical power of a t-test.
Example
Example 1: Find the 95% confidence interval for RMSSE and power of the one-way ANOVA of Example 1 of Power of One-way ANOVA.
The analysis is shown in Figure 1 (with references to cells in Figure 1 of Power of One-way ANOVA).
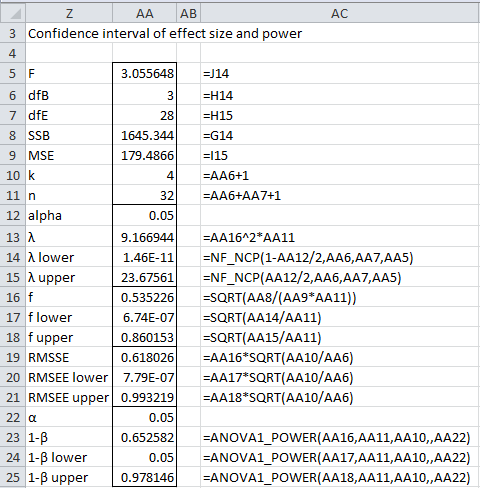
Figure 1 – Confidence intervals for RMSSE and statistical power
We see from Figure 1 that the 95% confidence interval for the noncentrality parameter is (0, 23.68). The corresponding confidence interval for the RMSSE of .62 is (0, .99), and the confidence interval for power of 65.3% is (5%, 97.8%).
Even though this test results in a relatively high effect size (.62) and power of 65.3%, because the sample is very small, the confidence intervals are quite wide. Thus, if we repeat the test with similar-sized data, it is not so unlikely that the resulting effect size and power will be near zero. This reinforces what we should already know, namely that caution needs to be applied when running statistical tests, especially with small sample sizes.
Links
Examples Workbook
Click here to download the Excel workbook with the examples described on this webpage.
References
Howell, D. C. (2015) Confidence interval on effect size
https://www.uvm.edu/~statdhtx/StatPages/ConfIntEffectSize/Confidence%20limit%20on%20effect%20size.html
Kang, K. et. al. (2021) Accurate confidence interval estimation for non-centrality parameters and effect size indices
https://www.researchgate.net/publication/356159543_Accurate_confidence_interval_estimation_for_non-centrality_parameters_and_effect_size_indices
Lecoutre B., (2007) Another look at the confidence intervals for the noncentral t distribution
https://digitalcommons.wayne.edu/jmasm/vol6/iss1/11/
Steiger, J. H., Fouladi, R. T. (1997) Noncentrality interval estimation and the evaluation of statistical models
https://statpower.net/Steiger%20Biblio/Steiger&Fouladi97.PDF
Hi Charles,
I have done meta-analyses. When I want to compare Cohen’s d from 2 metaanalyses, I have an Excel formula for the t-test based only on the effect sizes d1, d2 and n1, n2 (the number of participants in the 2 meta-analyses). I get a t-value which I can check for significance in an online source.
Now, what if I want to compare the d’s from 3 or more meta-analyses, I think I the t-test is not appropriate, and I have to do an ANOVA. Do you have an Excel formula that could be used for this problem, I mean, when I only have the d’s and the n’s ? Also, after doing the ANOVA, I will have to do post-hoc tests, to see which pairs of d’s differ significantly.
Kind regards, Borwin
Hello Borwin,
Sorry, but I don’t have such an Excel formula. I imagine that the approach is similar, namely that you need to calculate the F statistic in terms of d’s and n’s. I haven’t tried to do it, but you need to expand F to MSBet/MSW and then expand MSBet and MSW, which will principally depend on SSBet and SSW. Then hopefully you can find a way to express SSBet and SSW in terms of the d’s and n’s.
Charles