Basic Concepts
The F-distribution is primarily used to compare the variances of two populations, as described in Hypothesis Testing to Compare Variances. This is particularly relevant in analysis of variance testing (ANOVA) and in regression analysis.
Definition 1: The The F-distribution with k1, k2 degrees of freedom is defined by
![]()
Figure 1 displays the plots of the pdf of the F distribution at different values of k1, k2.
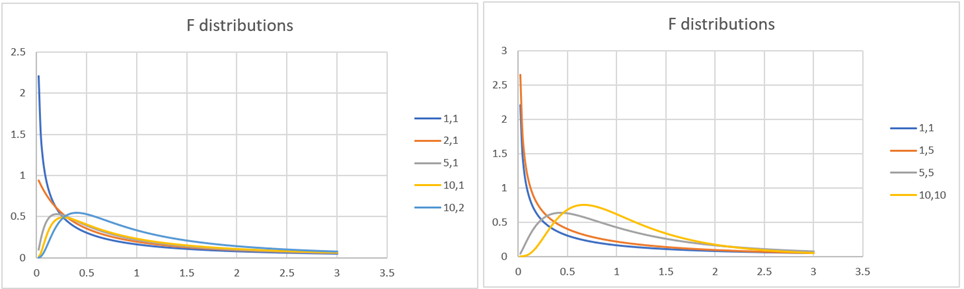
Figure 1 –Plots of F distributions
Key Properties
Property 1: If we draw two independent samples of size n1 and n2 respectively from two normal populations with the same variance then
![]()
where s12 and s22 are the observed variances of the two samples.
Proof: By Property 5 of Chi-square Distribution, If x is drawn from a normally distributed population N(μ, σ2) then for samples of size n:
![]()
Thus if we draw two independent samples from two normal populations with the same variance σ, then by Definition 1,
![]()
Property 2: A random variable t has t-distribution T(k) if and only if t2 has distribution F(1, k).
Thus, T.DIST.2T(x, df) = F.DIST.RT(x^2,1,df) for x ≥ 0. E.g. T.DIST.2T(3,10) = .013344 = F.DIST.RT(9,1,10).
Property 3: For k2 sufficiently large, a random variable x has distribution F(k1, k2) if and only if k1⋅ x has the chi-square distribution χ2(k1).
Thus, for large values of df2, we have F.DIST.RT(x, df1, df2) ≈ CHISQ.DIST.RT(x*df1, df1). E.g. for x = 3 and df1 = 4, we calculate that CHISQ.DIST.RT(3*4,4) = .017351. If df2 = 100 then F.DIST.RT(3,4,100) = .021997, while if df2 = 10,000 then F.DIST.RT(3,4,10000) = .017396, and if df2 = 1,000,000 then F.DIST.RT(3,4,1000000) = .017352, which is almost the same as the chi-square value.
Property 4: x ~ F(k1, k2) if and only if 1/x ~ F(k2, k1).
Worksheet Functions
Excel Functions: Excel provides the following functions for the F distribution where df1 > 0, df2 > 0, and cum = TRUE or FALSE.
F.DIST(x, df1, df2, cum) = the pdf value f(x) for the F distribution F(df1, df2) when cum = FALSE and the corresponding cdf value F(x) when cum = TRUE.
F.INV(p, df1, df2) = the value x such that F.DIST(x, df1, df2, TRUE) = p; i.e. the inverse of F.DIST(x, df1, df2, TRUE)
In addition, Excel provides the following worksheet functions:
F.DIST.RT(x, df1, df2) = the right tail at x of the F distribution with df1, df2 degrees of freedom
F.INV.RT(p, df1, df2) = the value x such that F.DIST.RT(x, df1, df2) = p; i.e. the inverse of F.DIST.RT(x, df1, df2)
The above functions are not available for versions of Excel prior to Excel 2010. For these versions of Excel, you can use the Excel functions FDIST(x, df1, df2), which is roughly equivalent to F.DIST.RT(x, df1, df2, TRUE), and FINV(α, df1, df2), which is roughly equivalent to F.INV.RT(α, df1, df2).
Note too that
F.DIST(x, df1, df2, TRUE) = 1 – F.DIST.RT(x, df1, df2) = 1 – FDIST(x, df1, df2)
F.DIST(1/x, df1, df2, TRUE) = F.DIST.RT(x, df2, df1)
F.INV(p, df1, df2) = F.INV.RT(1-p, df1, df2) = FINV(1-p, df1, df2)
F.INV(p, df1, df2) = 1/F.INV.RT (p, df2, df1)
Non-integer degrees of freedom
Excel only calculates the above functions for positive integer values of df1 and df2. Non-integer values are rounded down to the nearest integer. Thus, F.DIST(3,1.6,5,TRUE) = F.DIST(3,1,5,TRUE). In particular, all of the above Excel functions yield an error value when df1 < 1 or df2 < 1.
If you need a more accurate value for any of the F distribution functions when either or both of the degrees of freedom are not integers, and in particular when either of them is less than one, then you can use Real Statistics’ noncentral F distribution functions (with noncentrality value of zero), as described in Noncentral F Distribution. For example, the formula F.DIST(3,1,5,TRUE) = .8562, but F.DIST(3,0.99,5,TRUE) = #NUM!, whereas NF_DIST(3,0.99,5,0,TRUE) = .8606.
Relationship with beta distribution
Alternatively, you can use the following properties to deal with non-integer degrees of freedom:
Property 5: A random variable x has distribution F(df1, df2) if and only
![]()
where Bet is the beta distribution.
This property shows how to compute the cdf of the F distribution. The following property shows how to compute the pdf of the F distribution from the beta function.
Property 6: The pdf of the F(df1, df2) distribution can be computed as follows, where Beta is the beta function as defined in Beta Distribution:
![]()
More Worksheet Functions
Real Statistics Functions: The Real Statistics Resource Pack provides the following worksheet functions that implement Properties 5 and 6.
F_DIST(x, df1, df2, TRUE) = BETA.DIST(x*df1/(x*df1+df2), df1/2, df2/2, TRUE)
F_DIST(x, df1, df2, FALSE) = (df1/df2)^(df1/2)*x^(df1/2-1)/(BETA(df1/2,df2/2)*(1+x*df1/df2)^((df1+df2)/2))
F_INV(p, df1, df2) = x*df2/(df1*(1-x)) where x = BETA.INV(p, df1/2, df2/2)
Here, F_DIST is a substitute for F.DIST and F_INV is a substitute for F.INV. Not only do these functions provide better estimates of the F distribution when the degrees of freedom are not integers, but F_DIST is also useful in providing an estimate of the pdf for versions of Excel prior to Excel 2010, where F.DIST(x, df1, df2, FALSE) is not available.
The Real Statistics Resource Pack also provides the following functions:
F_DIST_RT(x, df1, df2) = 1 – F_DIST(x, df1, df2, TRUE)
F_INV_RT(p, df1, df2) = 1 – F_INV(p, df1, df2)
Examples Workbook
Click here to download the Excel workbook with the examples described on this webpage.
Links
↑ Chi-square and F distributions
References
Wikipedia (2012) F-distribution
https://en.wikipedia.org/wiki/F-distribution
Microsoft Support (2021) F.DIST function
https://support.microsoft.com/en-us/office/f-dist-function-a887efdc-7c8e-46cb-a74a-f884cd29b25d
Hello.
I am performing regression analysis with 10 independent variables. Three of the variables are significant but almost all variables show high VIF signifying multicollinearity problem. I have used step-wise regression to arrive at two most significant variables which give the highest adjusted r2 and low VIF values. My question is – Is my approach correct? Is it correct to just include the two most significant variables based on VIF and Adj R2?
Also , my professor suggested i use F-test and select the significant variables based on the Adj R2. Is this possible? Could you please guide me in the correct directions and share some links which help me better understand it?
Thanks
Warm regards
Mike
Hi Mike,
1. There are many approaches. Which to choose depends on your goal. Clearly, the approach with the largest R-square value uses all the independent variables. As you have seen, however, some of these variables are not significant and maybe they can be omitted without too much of an impact on the R-square value. Unfortunately, it can turn out that if you eliminate all the insignificant variables, you may not arrive at the “best” solution (even when multicollinearity is not an issue). In fact, it could turn out that if you add one (or more) of the insignificant variables back in, that variable now is significant. It can even happen that one of the previously significant variables is now insignificant.
2. Some strategies are explored at
https://real-statistics.com/multiple-regression/testing-significance-extra-variables-regression-model/
https://real-statistics.com/multiple-regression/stepwise-regression/
3. Your professor’s suggestion has merit since Adj R2 factors in the number of variables and is not just dependent on the R-square value. Metrics such as the AIC or BIC can also be useful since they add a penalty for using more variables than necessary.
Charles
Hello
It seem that the function for the F distribution pdf is returning wrong values.
Form may analysis, I think you are using the Beta distribution for the pdf and the cdf.
As strange as it may be, it seems that it can be used for the cdf. I think that the method to use is the one of the following VBA function
Function xlDistF(x, df1, df2, cum)
Dim Beta
With WorksheetFunction
If cum = 0 Then
Beta = Exp(.GammaLn_Precise(df1 / 2)) _
* Exp(.GammaLn_Precise(df2 / 2)) _
/ Exp(.GammaLn_Precise(df1 / 2 + df2 / 2))
‘Beta = xlDistBETAFUNCTION(df1 / 2, df2 / 2)
xlDistF = 1 / Beta * (df1 / df2) ^ (df1 / 2) * x ^ (df1 / 2 – 1) / (1 + df1 / df2 * x) ^ ((df1 + df2) / 2)
ElseIf cum = 1 Then
x = df1 * x / (df2 + df1 * x)
xlDistF = .Beta_Dist(x, df1 / 2, df2 / 2, 1)
End If
End With
End Function
Regards
António Teixeira
António,
Thanks for catching this. It does look like the value calculated by F_DIST(x,df1,df2,FALSE) is incorrect. I will correct this in the next release of the software. Thanks also for providing a corrected way to do the calculation. I really appreciate all the help you have provided over the years and value your important contributions.
Charles
Thanks again António. I have now corrected this error in the software and will include the change in the next release of the software.
Charles
Thank you so much for this valuable site! I have one suggestion: would it be possible to post a graph of the F distribution? Thank you!
Michael,
Ok, I will add this once I have issued the next software release.
Charles