Basic Concepts
While the F distribution characterizes how the F test statistic is distributed when the null hypothesis is assumed to be true, the noncentral F distribution instead shows how the F test statistic is distributed when the alternative hypothesis is assumed to be true (i.e. when the null hypothesis is assumed to be false). As such it is useful in calculating the power of tests (ANOVA, regression, etc.) that rely on the F distribution.
Definitions
Definition 1: The noncentral F distribution, abbreviated F(k1, k2, λ), has the cumulative distribution function F(x), written as Fk1,k2,λ(x) when necessary, where k1, k2 = the degrees of freedom and non-negative λ = the noncentrality parameter. In particular
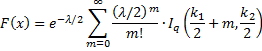
when x ≥ 0, where Ir(a,b) is the distribution function of the beta distribution
Iq(a,b) = BETADIST(q, a, b)
and![]()
When x < 0, the cdf of the noncentral F distribution is F(x) = 0.
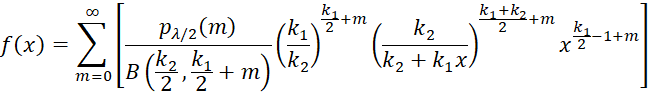
The probability density function (pdf) of the noncentral F distribution can be calculated as follows:

where B(a, b) is the beta function
![]()
and Γ(k) is the gamma function. B(a, b) can be calculated in Excel by the formula
=EXP(GAMMALN(a)+GAMMALN(b)−GAMMALN(a + b))
Algorithm
The calculation of the noncentral F distribution used in Real Statistics’ NF_DIST and related worksheet functions uses the following expressions for the pdf and cdf.
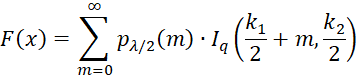
where pμ(z) = POISSON.DIST(z, μ, FALSE) is the pdf of the Poisson distribution with mean μ.
Thus, the pdf and cdf of the noncentral F distribution can be expressed to any desired degree of precision in Excel as a finite sum of terms using POISSON.DIST and BETA.DIST.
Worksheet Functions
Real Statistics Functions: The Real Statistics Resource Pack supplies the following worksheet functions:
NF_DIST(x, df1, df2, λ, cum, iter, prec). If cum = TRUE, then the value of the noncentral F distribution F(df1, df2, λ) at x is returned, while if cum = FALSE, then the value of the pdf at x is returned.
NF_INV(p, df1, df2, λ, iter, iter0, prec) = the inverse of the cdf of the noncentral F distribution F(df1, df2, λ) at p, i.e. the value of x such that NF_DIST(x, df1, df2, λ, TRUE, iter, prec) = p.
NF_NCP(p, df1, df2, x, iter, iter0, prec) = the value of the noncentrality parameter λ such that the cdf of the noncentral F distribution F(df1, df2, λ) at x is p, i.e. NF_DIST(x, df1, df2, λ, TRUE, iter, prec) = p.
BETA(x, y) = beta function at x, y
Here, iter = the maximum number of terms in the infinite sum that will be calculated (default 1,000), prec = desired level of accuracy of the power calculation (default 0.000000001), and iter0 = the number of iterations in calculating NF_INV and NF_NCP (default 40). df1 and df2 can take any positive values, including non-integer values.
Graph
The following chart shows the graphs of the noncentral F distribution with 5, 10 degrees of freedom for λ = 0, 1, 5, 10, 20. Note that when λ = 0, the distribution is the central F distribution, i.e. F(k1, k2, 0) = F(k1, k2).

Figure 1 – Noncentral F pdf by noncentrality parameter
Examples Workbook
Click here to download the Excel workbook with the examples described on this webpage.
Links
↑ Chi-square and F distributions
References
Steier, J. F. and Fouladi, R. T. (1997) Noncentrality interval estimation and the evaluation of statistical models
http://www.statpower.net/Steiger%20Biblio/Steiger&Fouladi97.PDF
Krishnamoorthy, K. (2006) Handbook of statistical distributions with applications. Chapman and Hall
https://www.academia.edu/41846183/Handbook_of_Statistical_Distributions_with_Applications
Benton, D. and Krishnamoorthy, K. (2003) Computing discrete mixtures of continuous
distributions: noncentral chisquare, noncentral t and the distribution of the square of the sample multiple correlation coefficient. Computational Statistics & Data Analysis 43. 249 – 267
https://papers.ssrn.com/sol3/papers.cfm?abstract_id=3142698
Hi Charles,
Could you kindly drop me an email to help me find out the issue of below VBA codes?
my email: ytsscn@163.com
I am trying to understand the algorithm of your NF_DIST() function that is being used for “Power for One-way ANOVA”, so I write the below codes to repeat what NF_DIST() does. However, their calculated values are different, which confused me a lot.
Public Function LF_DIST(x As Double, df1 As Long, df2 As Long, lamda As Double) As Double
Dim m As Long, sum As Double, A As Double, B As Double
sum = 0
For m = 0 To 1000 Step 1
A = Application.WorksheetFunction.Poisson_Dist(m, lamda / 2, False)
B = Application.WorksheetFunction.Beta_Dist(df1 * x / (df1 * x + df2), df1 / 2 + m, df2 / 2, False)
sum = sum + A * B
Next m
LF_DIST = sum
End Function
Hi Ryan,
No problem. I sent you an email earlier today.
Charles
Dear Charles,
As per your calculation algorithm for NF_DIST() function, I have come up with the VBA function LF_DIST() as below. However, it does not get the same result as your cumulative NF_DIST(). Could you help me find out the issue with my codes?
Thank you so much.
Public Function LF_DIST(x As Double, df1 As Long, df2 As Long, lamda As Double) As Double
Dim m As Long, sum As Double, A As Double, B As Double
sum = 0
For m = 0 To 1000 Step 1
A = Application.WorksheetFunction.Poisson_Dist(m, lamda / 2, False)
B = Application.WorksheetFunction.Beta_Dist(df1 * x / (df1 * x + df2), df1 / 2 + m, df2 / 2, False)
sum = sum + A * B
Next m
LF_DIST = sum
End Function
Thanks,
Ryan
See my email reply.
Charles
Hi Charles,
Can you use the non-central F-distribution to carry out equivalence tests between two or more groups? Thanks
Hello Jeanluc,
I am not familiar with these tests, but see https://www.mdpi.com/1099-4300/18/8/291/htm
Charles
Hi, How are you doing?
I am looking for VBA code of the cumulative distribution function (CDF) for the noncentral F-distribution, but I have not found.
Do you have one?
Could you help me?.
Thanks so much.
Karol
Karol,
The algorithm is pretty much described on the referenced webpage. If you know VBA it shouldn’t hard to implement.
Charles
Thanks so much!
I am looking for type error II probability, so I think that I have to use NF_NCP Function, but I have only the tree input as
df1, df2, FI and Noncentrality parameter (λ).
What does p, df1, df2, x, m, iter means?
Sorry for my lack of knowledge.
Could you help me to understand a little more
thanks so much.
Karol
Karol,
These parameters are defined on the referenced webpage, but let me give you an example using the NF_NCP function, more specifically formulas of form NF_NCP(p, df1, df2, x, m, iter), which calculate the value of the noncentrality parameter lambda λ.
p = the significance level, usually referred to as alpha; most commonly p takes the value .05
df1, df2 = degrees of freedom; in fact in the standard Excel formula F.INV(p,df1, df2) for the inverse of the F distribution, the p, df1 and df2 are the same as those in the noncentrality F distribution.
x = the value of the F statistic; in fact this the same value of x that is used in the standard Excel formula F.DIST(x, df1, df2, cum) for the F distribution.
m = the upper limit in the infinite sum (1 – 170, default 40); don’t worry about this parameter, just use the default value.
iter = the number of iterations used to calculate NF_INV or NF_NCP (default 40); don’t worry about this parameter, just use the default value.
Charles
One more time, thanks so much,
Now I could understand how that function work.
Thanks for your time.
Karol
Hi,
Please, can you tell me if is possible to use RealStats Add-in in VBA.
I want to run the RealStats Add-In Function in VBA. Is it possible?
Thanks
Karol
Karol,
Yes you can call Real Statistics functions in VBA as described on the webpage https://real-statistics.com/excel-capabilities/calling-real-statistics-functions-in-vba/.
Charles
Hi
Work well,
thanks,
Karol