Based on Property 7 of Chi-square Distribution, we can use the chi-square distribution to test the variance of a distribution.
Hypothesis Test
Example 1: A company produces metal pipes of a standard length. Twenty years ago, it tested its production quality and found that the lengths of the pipes produced were normally distributed with a standard deviation of 1.1 cm. They want to test whether they are still meeting this level of quality by testing a random sample of 30 pipes and finding the 95% confidence interval around σ2.
By Property 7 of Chi-square Distribution
![]()
Note that since the chi-square distribution is not symmetric, the confidence interval is not symmetric around σ2, and so the approach used in Confidence Intervals for Sampling Distributions and Confidence Interval for t-test needs to be modified somewhat. In particular, we need to calculate the lower and upper values of the confidence interval based on different critical values of the distribution:
Upper limit = 0.042*CHISQ.INV.RT(.025, 29) = 0.042 ∙ 45.72 = 1.91
Lower limit = 0.042*CHISQ.INV.RT(.975, 29) = 0.042 ∙ 16.05 = 0.67
Thus, the confidence interval is (0.67, 1.91). Since the population variance of (1.1)2 = 1.21 is in this range, we cannot reject the null hypothesis that the population standard deviation is still 1.1.
We summarize the calculation in Figure 1.
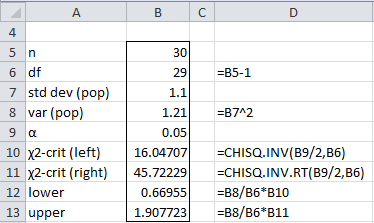
Figure 1 – Two-tailed variance test
One-Tailed Test
Example 2: A company produces metal pipes of a standard length, and claims that the standard deviation of the length is at most 1.2 cm. One of its clients decides to test this claim by taking a sample of 25 pipes and checking their lengths. They found that the standard deviation of the sample is 1.5 cm. Does this undermine the company’s claim?
We perform a one-tailed test based on the following hypotheses:
H0: the standard deviation of the pipe length is ≤ 1.2 cm
H1: the standard deviation of the pipe length is > 1.2 cm
If we assume that the population has a normal distribution, then by Property 7 of Chi-square Distribution, we know that
![]()
Since
![]()
it follows that
p-value = CHISQ.DIST.RT(x, df) = CHISQ.DIST.RT(37.5, 24) = 0.039 < .05 = α
and so the null hypothesis is rejected, leading the client to conclude with 95% confidence that the company is no longer meeting its claimed quality standard.
Alternatively, x-crit = CHISQ.INV.RT(α, df) = CHISQ.INV.RT(.05, 24) = 36.42 < 37.5 = x, and so once again the null hypothesis is rejected. These results are summarized in Figure 2.
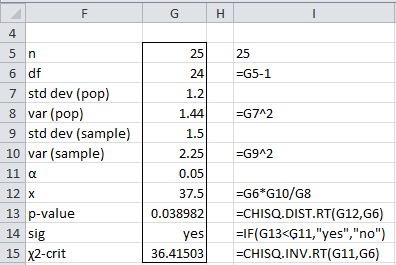
Figure 2 – One-tailed variance test
Two-Tail Test
In Example 2 we used a one-tailed test. For a two-tailed test, proceed as follows using the null hypothesis
H0: the standard deviation of the pipe length is = 1.2 cm
We reject the null hypothesis if either CHISQ.DIST.RT(x, df) = .039 < .025 = α/2 or CHISQ.DIST.RT(x, df) = .039 > 1 – α/2 = .975. As result, in this case, we can’t reject the null hypothesis. Alternatively, we reject the null hypothesis if either 37.5 = x > CHISQ.INV.RT(α/2, df) = CHISQ.INV.RT(.025, 24) = 39.4 or 37.5 = x < CHISQ.INV.RT(1–α/2, df) = 12.4, and so once again we cannot reject the null hypothesis in the two-tailed test.
Examples Workbook
Click here to download the Excel workbook with the examples described on this webpage.
Links
↑ Chi-square and F distributions
References
Zar, J. H. (2010) Biostatistical analysis 5th Ed. Pearson
NIST (2012) Chi-square test for the variance
https://www.itl.nist.gov/div898/handbook/eda/section3/eda358.htm
in example 2:
claims that the standard deviation of the length is at most 1.2 cm. at most means
h1 : the standard deviation of the pipe length is < 1.2 cm
Hello Audumbar,
At most means “…<= 1.2 cm". Charles
In example 2 is it wrong if we say ho = 1.2 ?
Thanks
Sam,
You wouldn’t say H0 = 1.2. You can say
H0: the standard deviation of the pipe length = 1.2 cm
This would be the two tailed version of the null hypothesis.
Charles
Hello Dr. Zaiontz,
I found an online calculator that shows how to calculate a confidence interval for Chi square here: http://www.mathcelebrity.com/chiconf.php?n=+30&variance=+1.21&conf=+95&pl=Variance+Confidence+Interval . I put your Example 1 into it, and I don’t get the same answer for the confidence interval. I’m just wondering what is going on here, or what the mathcelebrity website calculator is doing differently? Thanks!
Jesse,
In Example 1 we are finding the confidence interval for s^2 given that we know the population variance. The calculation you are referring to finds the confidence interval for the population variance given that you know the sample variance.
Charles
Charles:
I am seeing an inconsistency in certain aspects of the literature concerning this test. I would like your input in this matter. In conducting a two tailed chi-squared test for a single population variance, it is clear that one computes the p value by doubling the smaller area on a side of the calculated value of the test statistic. Does one then compare that p-value to alpha or to alpha/2? I say alpha as with all other hypothesis tests. However, if one does not double the aforementioned smaller area, then I suspect that the proper comparison is to alpha/2. That said, then one should not call the non doubled area the p value, correct? You would actually be comparing p-value/2 to alpha/2 which would be a valid comparison, but you would not be using the p value per se. What do you think?
Alan,
If the p-value for the one-tail test is say .02, then for a symmetric distribution the p-value for the two-tailed test is .04, which you can compare with alpha (say .05).
Equivalently, you can use the one-tailed p-value of .02 and compare it with alpha/2 = .025.
This is true, for example, for the t test. You need to be careful with the chi-square distribution since it is not symmetric.
Charles
What would the nonparametric equivalent be?
Patty,
Wilcoxon Signed Ranks Test
Charles
Hi Charles,
Is it possible to construct a hypothesis test where H0: variance = 0 ; H1: variance > 0?
Lionel,
You are asking for a one-tailed test. Example 2 of the referenced website shows a one-tailed test (while Example 1 shows a two-tailed test).
Note: since variance is always a non-negative number, variance > 0 is equivalent to variance <> 0.
Charles
I have a same queation but can not find the result, I am looking for a test to test if the variability of my sample is close to zero, if i want to use chi-square test i would have zero in the denominator.!!!
Parisa,
This is a good question. I hadn’t thought about it before. Essentially zero variance means that all the data is the same (and so is equal to the mean). Thus, let w = abs(x-mean) where mean is the mean of your sample. Thus you could perform a one sample t test to see whether the w values have a mean of zero.
Charles
Hello Charles, how do I calculate p-value for test where H0: VAR = anything; H1: VAR anything? (two tailed test). Do I have two P values?
Even in a two tailed test, you only have one p-value. This single value needs to take into account both the right tail and the left tail.
Charles