Basic Concepts
Let 

![]()
Finally, let δ =
![]()
For the one-tailed test H0: 

![]()
![]()
For the one-tailed test H0:
![]()
![]()
Examples
Example 1: Calculate the power of a one-tailed two-sample variance test where α = .05, the sizes of the two samples are 50 and 60, and the corresponding variances are 1.75 and 2.25.
The power of the test is 23.4% as shown in Figure 1.
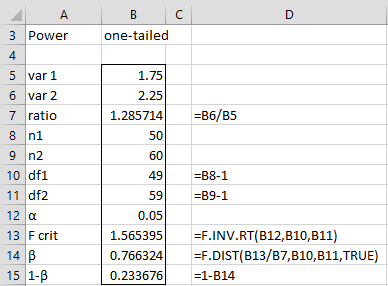
Figure 1 – Power of two-sample variance testing
Example 2: Calculate the power of the two-tailed two-sample variance test where α = .05, the sizes of the two samples are 50 and 60, and the corresponding standard deviations are 1.2 and 1.5.
Note that this time we are given the standard deviations, and so we must square these values to find the ratio of the variances. The power of this test is 37.1% as shown in Figure 2.
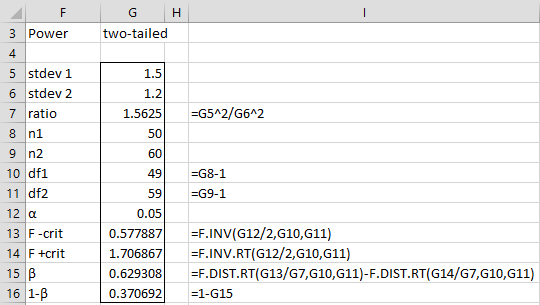
Figure 2 – Power of two-sample standard deviation testing
Worksheet Functions
Real Statistics Functions: The Real Statistics Resource Pack provides the following worksheet functions:
VAR2_POWER(ratio, n1, n2, tails, α) = the power of a two-sample variance test where ratio =
VAR2_SIZE(ratio, 1−β, tails, α, nratio) = the minimum sample size required to achieve power of 1−β (default .80) in a teo-sample variance test where ratio =
For VAR2_SIZE, only the size of the first sample is returned. If the two samples don’t have the same size, you need to specify the size of the second sample in terms of the size of the first sample using the nratio argument. E.g. if the size of the second sample is half of the first, then set nratio = .5.
If you set nratio to be a negative number, then the absolute value of this number will be used as the sample size of the second sample. E.g. if nratio = -50, then the VAR2_SIZE function will find the size of the first sample assuming that the second sample has 50 elements.
For Example 1, =VAR2_POWER(B7,B8,B9,1,B12) = 0.233676, which returns the same value shown in Figure 1. For Example 2, the formula =VAR2_POWER(G7,G8,G9) = 0.370692, which returns the same value shown in Figure 2.
Example 3: Calculate the sample size required to obtain a power of 80% for the test in Example 2, assuming both samples have the same size.
The size of each sample is 160, as calculated by =VAR2_SIZE(G7).
Data Analysis Tool
Real Statistics Data Analysis Tool: You can also use the Real Statistics Statistical Power and Sample Size data analysis tool to determine the power of a two-sample variance test. In addition, you can use this tool to determine the sample size required to achieve a specified statistical power target. See the Real Statistics Power Data Analysis Tool for details.
Examples Workbook
Click here to download the Excel workbook with the examples described on this webpage.
Links
↑ Chi-square and F distributions
Reference
Faul, F., Erdfelder, E., Lang, A.-G., & Buchner, A. (2014) G*Power 3.1 manual
https://www.psychologie.hhu.de/fileadmin/redaktion/Fakultaeten/Mathematisch-Naturwissenschaftliche_Fakultaet/Psychologie/AAP/gpower/GPowerManual.pdf
Faul, F., Erdfelder, E., Lang, A.-G., & Buchner, A. (2007). G*Power 3: A flexible statistical power analysis program for the social, behavioral, and biomedical sciences. Behavior Research Methods, 39(2), 175–191.
https://doi.org/10.3758/BF03193146
Dear Charles,
As an Engineer, I appreciate how you simplify the statistics and have enjoyed many of your posts. Unfortunately there is a bug in lines 15 and 16. The Beta Risk for Ha is 0.62931 and the Power is 0.37069. Please see Excel work below
Beta Ha< = 1 – F.Dist(F.Inv(0.05, 50-1,60-1) / 1.5625, 50-1, 60-1, True)=0.99930
Beta Ha = F.Dist(F.Inv(1-0.05/2, 50-1, 60-1)/1.5625, 50-1, 60-1, True) -F.Dist(F.Inv(0.05/2, 50-1, 60-1)/1.5625, 50-1, 60-1, True) = 0.62931
Beta Ha> = F.Dist(F.Inv(1-0.05, 50-1, 60-1)/1.5625, 50-1, 60-1, True)=0.50606.
These results were confirmed to 4 decimal places via 2 billion Monte-Carlo iterations in VisualBASIC 6, using a program checked to 5 decimals against theory using Means, Variances and Tails of F, t, CHI^2 and t distributions for both Ho and Ha cases.
It is unfortunate the user-friendly Minitab Power option can not handle unequal n values.
Please tell me why this simple method is not easy to find outside of your work, but there is discussion of F power as it relates to other tests using a different non-centrality parameter. Thanks.
Hello Bruce,
Thanks for identifying this error. I appreciate your help in improving the accuracy of the website and I will revise this webpage later today.
The calculations on the Distribution examples workbook look correct as well as the results that you get from the VAR2_POWER function and Statistical Power and Sample Size data analysis tool.
I am pleased that you were able to get a result from Real Statistics that you weren’t able to get from other sources, although please note that G*Power also enables you to specify unequal sample sizes.
Charles
Charles, Don’t you have to calculate a non centrality lambda for statistical power? G*Power requires this for a post-hoc power calculation for F tests.
For F Critical: Why are you using 1 – alpha? Just curious.
Ed
Hello Edward,
I just checked again and see that the power calculated by Real Statistics is identical to that calculated by G*Power. Can you give me an example where they differ?
Charles
Dear Charles,
Recently I asked this question on RG: “I have two independent groups and for calculating differences in variance I want to use VR (variance ratios),
VR = variance of group A / variance of group B
How I should calculate the standard error of VR?”
https://www.researchgate.net/post/Calculating_the_standard_error_of_variance_ratios
Unfortunately, I couldn’t find my answer anywhere. In some meta-analysis papers, they present VR and d (standardized mean difference) together and I found the formula for calculating standard error of d here: Introduction to Meta-Analysis, 2009, Borenstein, page 26.
I hope you can help me.
Best Regards,
Majid,
Is it sufficient for you to have a confidence interval for the variance ratio?
Charles
AS I said I want to calculate the standard error of VR. If it can help I can send this chapter of that book and a meta-analysis paper using this method for you.
Majid,
If you send me the chapter from the book and the meta-analysis paper, I will look into it and try to help you.
Charles
I sent them for you on your RG account.
Majid,
Thanks. I will take a look at these papers.
Charles