On this webpage, we show how to determine the statistical power of a one-sample chi-square test of the variance. We also show how to determine the minimum sample size for this test. See Statistical Power for background information.
Calculation of the Power
Let 
x-crit = CHISQ.INV(α/2,n−1) x+crit = CHISQ.INV.RT(α/2,n−1)
Let δ = s2/
β = CHISQ.DIST(x+crit/δ,n−1,TRUE) − CHISQ.DIST(x-crit/δ,n−1,TRUE)
For the one-tailed test H0: 
xcrit = CHISQ.INV.RT(α,n−1)
β = 1−CHISQ.DIST.RT(xcrit/δ,n−1)
For the one-tailed test H0:
xcrit = CHISQ.INV(α,n−1)
β = CHISQ.DIST(xcrit/δ,n−1)
The power of the test is then equal to 1–β.
Example
Example 1: Calculate the power for the one-tailed and two-tailed tests from Example 3 of One Sample Variance Testing based on a sample of 50 pipes.
The results are shown in Figure 1: 73.4% for the one-tailed test and 63.9% for the two-tailed test.
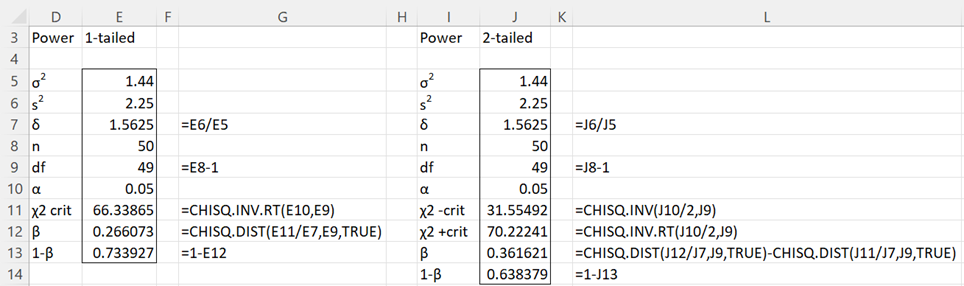
Figure 1 – Power of a one-sample test of the variance
Sample Size
The minimum sample size required for the one-sample variance test can be found by changing the sample size value in Figure 1 until the desired power is achieved. Alternatively, Excel’s Goal Seek can be used as explained in Sample Size for t-Tests. Finally, the VAR1_SIZE worksheet function can be used as explained next.
Worksheet Functions
Real Statistics Functions: The Real Statistics Resource Pack provides the following worksheet functions.
VAR1_POWER(δ, n, tails, α) = the power of a one-sample chi-square variance test where δ = s2/
VAR1_SIZE(δ, 1−β, tails, α) = the minimum sample size required to achieve power of 1−β (default .80) in a one-sample chi-square variance test where δ = s2/
For Example 1, VAR1_POWER(E7,E8,1,E10) = 0.733927 and VAR1_POWER(J7,J8,2,J10) = 0.638379, which are the same as the results shown in Figure 1.
Example 2: Calculate the sample size required to detect an effect of size .64 with statistical power of .80 where alpha = .05 for the one-tailed and two-tailed tests.
The one-tailed test requires a sample size of VAR1_SIZE(.64, .80, 1, .05) = 67 and the two-tailed test requires a sample of size VAR1_SIZE(.64) = VAR1_SIZE(.64, .80, 2, .05) = 86.
Data Analysis Tool
Real Statistics Data Analysis Tool: The Statistical Power and Sample Size data analysis tool can also be used to calculate the power and/or sample size. To do this, press Ctrl-m and select this data analysis tool from the Misc tab. On the dialog box that appears, select the One-sample variance option and either the Power or Sample Size options.
See Real Statistics Power Data Analysis Tool for more information and examples.
Examples Workbook
Click here to download the Excel workbook with the examples described on this webpage.
Links
↑ Chi-square and F distributions
References
Zar, J. H. (2010) Biostatistical analysis 5th Ed. Pearson
NCSS (2014) Tests for one variance
https://www.ncss.com/wp-content/themes/ncss/pdf/Procedures/PASS/Tests_for_One_Variance.pdf
Hi,
Quick question, based on the power of a two tailed test. When I calculate as indicated on figure 1 on this webpage, I got the same answer 0.638378932. However when I used the Statistical Power and Sample Size data analysis tool , the output for the left and right critical limits matches those in figure 1, but the power of the test is 0.482853828115. I just wanted some clarity on the difference in power.
Once again thank you for the amazing website, it’s been an amazing learning tool.
Hello Betty,
In Statistical Power and Sample Size data analysis tool, the field labeled Variance should be labeled Variance Ratio. If you enter the value 1.56259 in this field you should get Power = 0.638378932.
Thanks for bringing this issue to my attention. I will correct the label in the next release of the Real Statistics software, which should be available shortly.
Charles
Hi,
Thank you for the help, I really appreciate it.
Betty
Hi Charles
Why in this case you use the Chi-square also for the H1, while in the power for the goodness of fit test you use the Noncentral Chi-square?
Hi Ben,
It is a good question, but I don’t know the answer.
Charles
Hello Charles,
I am checking with you whether VAR1_POWER function has been amended to use the correct first argument. The current first argument of the function does not produce the right results as Javier and Daniel reported. The current setting takes the effect size as the sample variance divided by the pop variance, instead.
Thanks,
-Sun
Sun,
I believe that the function works correctly. The order of the two variances was changed after the comments by Javier and Daniel.
Currently, I use the population variance divided by the sample variance. This produces the same results as found on G*Power.
Charles
Sun,
I believe that the function works correctly. The order of the two variances was changed after the comments by Javier and Daniel.
Currently, I use the population variance divided by the sample variance. This produces the same results as found on G*Power, a commonly used tool for calculating statistical power and sample size.
Charles
Hi. Already using the RealStats pack to do some underrated but quite interesting statistical power calculations.
When I plug VAR1_POWER(0.64,50,1,0.05) I get 0,677983 and when plugging VAR1_POWER(0.64,50,2,0.05) I get 0,539065. The VAR1_SIZE values I get are the same than in the example. I’m using Excel 2016.
Could this be a matter of some iteration or precision settings somewhere in Excel I need to adjust?
Javier,
Sorry, but I don’t understand what you mean “the VAR1_SIZE values I get are the same than in the example”. Please explain.
Charles
Hi Charles,
I love the website and the add in. I tend to recommend it to people whenever the opportunity arises.
I had exactly the same problem that Javier had, and found that I could get the correct outputs when I used 1/δ as my first argument. So it seems like the issue is based around which variance is taken to be the hypothetical. However, Example 1 as illustrated, is still producing 0.677983 and 0.539065 for one and two-tailed tests respectively (at least in my experience).
Thanks.
Daniel,
I thought that this was already fixed in Rel 4.14, but if not I will make sure that it is fixed in the next release (Rel 4.15). I am finishing up the testing for this release and it should be available soon.
Charles
I just double checked the example using a fresh copy of your add-in. I can confirm that my results are still as described above.
As always, thank you for your generous work.
Daniel,
I will make sure that this change is made in Rel 4.15.
Charles
Hi,
Why for the second one-tailed test, at the call of CHIDIST, did you divided by delta instead of multiply?
Alex,
It is just the way the algebra works out.
Charles
Hi Charles,
I believe you have a few inconsistencies on this page.
1). The sample size you use for this problem is 50, but the sample size from the problem you reference is 25.
2). At the top of the page you say X-crit = CHIINV(a/2, n-1) and X+crit = CHIINV(1-a/2, n-1) but in your two tailed problem you use the inverse.
3). When you talk about the answers given by var1_power you use var1_power(E7, E8, 1, E10) for the 2 tailed case. I’m guessing you mean var1_power(J7, J8, 2, J10), which does give the correct answer.
4). When I plug in VAR1_SIZE(0.64, 0.80, 1, .05) and VAR1_SIZE(0.64, .80, 2, .05) I get 67 and 86. I’m using Excel 2013 on a Windows.
Jonathan,
Thanks for carefully looking at this webpage and finding the mistakes identified in your comment. I have now made the necessary corrections on the webpage. I really appreciate your diligence and help in making the website more accurate, and therefore easier to understand.
Charles
No problem.
I LOVE this website.
Studying its contents has now become my sacred daily ritual and acquiring a higher understanding of mathematics is incredibly gratifying.
There is no way I’d ever be able to learn what I’m learning without this site.
Jonathan,
I am please to hear this. I am glad that you are learning a lot from the site and I appreciate your diligence in finding errors to help improve the site.
Charles