Objective
The Cochran-Armitage test is used to determine whether there is a linear trend when the response is binary. This test is used with data in the form of a contingency table, such as that described in Independence Testing, where there are only two data rows, and we suspect (or hope) that the columns are ordered.
For example, in clinical trials, we might be interested in the relationship between increased dosage and the effect of a drug or treatment under study. The effect of the drug or treatment is binary (e.g. cured not cured), while the dosage levels are ordinal (e.g. 10 mg, 20 mg, 30 mg, etc.).
Example
Example 1. Determine whether there is a linear trend based on the dosages (0, 10, 20, or 30 mg) for the drug treatment illustrated in Figure 1. Here the first data row counts the number of patients who were not cured while the next row counts the number of patients who were cured.
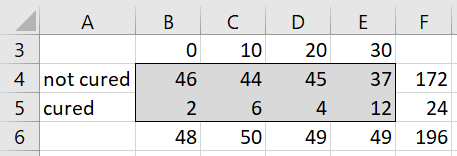
Figure 1 – Drug Treatment data
Before presenting the Cochran-Armitage test results for Example 1, we first provide some theoretical background.
Theoretical Background
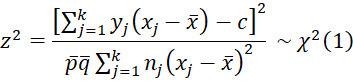
Let xj be the (numeric) labels of the columns (j = 1, 2, …k), nj = the number of elements in the jth column, and yj = the value in the cell in the first row and jth column. Define pj = yj/nj (the observed response probability) and
![]()
The one-sided hypotheses are:
H0: π1 = π2 = … = πk
H1: π1 ≤ π2 ≤ … ≤ πk with at least one strict inequality
Here, πj is the population probability that corresponds to the sample proportion pj.
The null hypothesis for the two-sided test is as for the one-sided test, and the alternative hypothesis is either π1 ≤ π2 ≤ … ≤ πk or π1 ≥ π2 ≥ … ≥ πk with at least one strict inequality.
The Cochran-Armitage test is
which is equivalent to
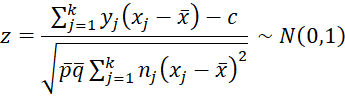
Here, c is an optional continuity correction factor. If the xj are equally spaced then a suitable correction factor is c = (xj+1–xj) /2 for any j < k. If the xj are not equally spaced then a possible correction is
![]()
although it is probably better not to use a correction factor at all in this case.
Test
For the one-sided test, the null hypothesis is rejected when z ≥ zcrit where zcrit = NORM.S.INV(1–α), the right-sided critical value.
For the two-sided test with no continuity correction, the null hypothesis is rejected when |z| ≥ NORM.S.INV(1–α/2). When the continuity correction factor is used, then the null hypothesis is rejected when z+≥ zcrit+ or z– ≤ zcrit-. Here, z+ is the z-statistic described above, and zcrit+ = NORM.S.INV(1–α/2) is the right tail critical value. z– is the z-statistic described above, except that the correction factor is added instead of subtracted, and zcrit- = NORM.S.INV(α/2) is the left tail critical value.
Example continued
The analysis for Example 1, where no correction factor is used, is shown in the upper part of Figure 2. Since we obtain a significant result (p-value = .0066 < .05 = alpha in the two-tailed test), we conclude that there is a linear trend.
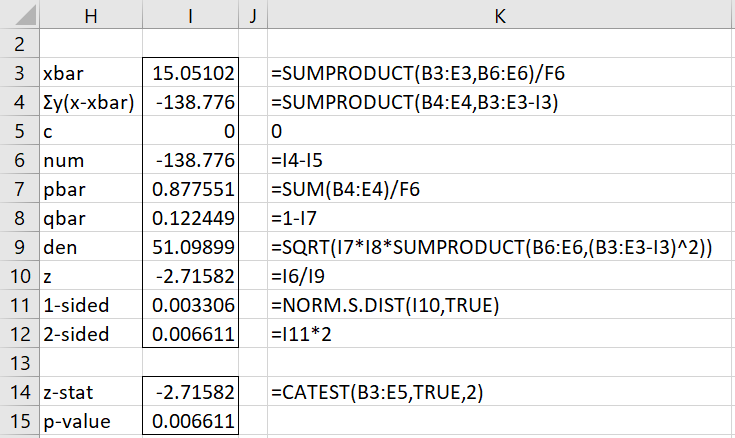
Figure 2 – Cochran-Armitage Test
If a non-zero correction factor is used in cell I5, the calculations for the left-sided test are identical to those shown in Figure 2. In fact, if we use a correction factor of 5, based on =(C3-B3)/2, then z = -2.81367 and p-value = .002449. For a right-sided test, the formula in cell I6 changes to =I4+I5, which, for a correction factor of 5, results in z = -2.61797 and p-value = .004423. The p-value for the two-sided test is then p-value = .002449 + .004423 = .006872.
Worksheet Function
Real Statistics Function: The following array function is provided in the Real Statistics Resource Pack to carry out the Cochran-Armitage test.
CATEST(R1, lab, tails): returns a 2 × 1 array consisting of the z-statistic and p-value for the test. R1 is a 2 × k contingency table with 3 rows, the first of which contains numeric labels in increasing order. tails = 1 (default) or 2. if lab = TRUE then an extra column is appended to the output with labels (default FALSE).
This function does not use a correction factor.
Note that the array formula =CATEST(B3:E5,TRUE,2) in range H14:I15 of Figure 2 yields the same test results as shown in the rest of the figure.
Examples Workbook
Click here to download the Excel workbook with the examples described on this webpage.
Links
↑ Chi-square and F distributions
Reference
Hintze, J. L. (2008) Cochran-Armitage Test for Trend in Proportions. NCSS
https://www.ncss.com/wp-content/themes/ncss/pdf/Procedures/PASS/Cochran-Armitage_Test_for_Trend_in_Proportions.pdf
Hi Charles. Thanks for this package – I use it a lot!. However, there is something I don’t understand with the CATEST . If I run the test with your example 1, with lab= FALSE and 2 tailed. I get the results you post. However, if I swap the not cured and the cured rows (i.e B4:E4 and B5:E5), I now get p = 1.0000. With a 2 tailed tests, I assumed I should be testing if there is a either positive or negative trend and I had expected that the p value should be the same regardless which of the “cured” or “not cured” vectors come first (i.e. the test should be symmetrical). When I look harder, with the original example 1, it seems that you are testing if there is a negative trend in the “not cured” rather than a positive trend in the “cured” I assume I am missing something in the logic. Could you please explain a bit more as to which of the two binary outcomes should be the test line (row 4 in your example). Thanks a lot.
Hello Allan,
The answer should be the same.
I just fixed the bug that produced this error. It should be available shortly in Rel 9.5.6.
Thanks for calling this error to my attention.
Charles
Thanks. I look forward to 9.5.6
May I ask if this new version is available yet? I downloaded the package today (25 AUG 2025) and am still seeing the error that Allan described when running the C-A test of trend.
Thank you,
Mark
Mark,
I apologize for the delay in issuing the new release. I am still testing the new release and will issue it once the testing is done.
In the meantime, you can still use the CA test provided you use the correct ordering of the data.
Charles
Mark,
I expect to issue the new release by September 10.
Charles
Hi Victor, What test I should apply on my SNP data in which major allele in cases is 32, minor allele 67 while in controls major allele is 99 and minor allele is 0. In genotypes AA major genotypes are 68, minor genotypes TT are 128 and TA is 3 in cases . In controls AA is 199, TT =0 and TA=0. kindly give full statistic analysis and its interpretation.
What are the assumptions for this test?
Hello Mirra,
You raise a good question. The following address your question but only partially.
https://stats.stackexchange.com/questions/578222/what-are-the-assumptions-of-the-cochran-armitage-test-for-trend
https://www.lexjansen.com/wuss/2019/175_Final_Paper_PDF.pdf
Charles
Hi Charles, brilliant website and software!
Small query, based on the excel sheet above, is there a way to get the chi statistic?
Hi Victor,
The version of the test that I am using reports the z-statistic. The chi-square statistic is the square of the z-statistic. For the example on the webpage, 2*NORM.S.DIST(-2.71582,TRUE) produces the p-value .006611. Note that 1-CHISQ.DIST((-2.71582)^2,1,TRUE) also equals .006611.
Charles
Thanks for swift reply, worked a charm! Please check Excel at bottom of page you may have switched 1 and 2 tailed p values.
Ignore last comment lapsus on my part 😉
I get it but where is the CATEST worksheet function? I installed the resource pack. When I click control-M, however none of the dialogue boxes or secondary dialogues under any of the tabs have CATEST or Cochran Armitage. What am I missing?
Hello,
You use CATEST just like any other Excel worksheet function (COUNT, NORM,DIST, AVERAGE, etc.).
Charles
Hi Charles! I’m sorry to bother you. I was wishing to attempt to do a Cochran-Armitage Test, but I am unable to find this test in the Resource Pack, and (for some reason) when I downloaded the excel workbook it was not something that was usable for me. I had to allow external links, and then that data looked like gibberish. So I am altogether confused here.
To summarize, in the report I’m reviewing, the investigators analyzed data using an exact one-tailed Cochran-Armitage test. But they did not analyze the CORRECT data, and I’d like to be able to do that, but I am unable to locate this test in the resource pack.
Thank you for any assistance.
Hi Donna,
As described on this web page, you can conduct the Cochran-Armitage Test by using the CATEST worksheet function supplied by the Real Statistics Resource Pack.
Charles