Minimum sample size example
Example 1: What is the minimum sample size needed to obtain power of at least 80% for a two-sample, two-tailed t-test with null hypothesis μ1 = μ2 to detect an effect of size d = .4 assuming that both samples have the same size?
We begin by repeating Example 3 of Statistical Power of the t-tests, assuming that the two sample sizes are equal (see Figure 4 of Statistical Power of the t-tests).
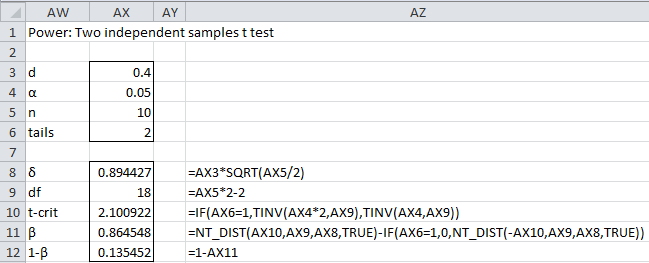
Figure 1 – Initialize search for sample size
Goal Seek
We now employ Excel’s Goal Seek capability by selecting Data > Data Tools|What-if Analysis > Goal Seek… When a dialog box as in Figure 2 appears, fill in the fields as indicated.
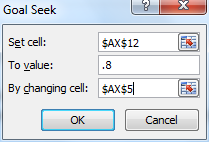
Figure 2 – Goal Seek dialog box
The results are shown in Figure 3.

Figure 3 – Sample size needed to achieve 80% power
Rounding up to the nearest integer, we see that a sample size of 99 is required to detect an effect of .4 with power of about 80%. In fact, we see that a sample size of 99 still leaves us just short of 80% power. We need a sample of size 100 to achieve 80% power; note that T2_POWER(.4,100) = .803648.
Worksheet Functions
This same result can be achieved using the second of the following worksheet functions.
Real Statistics Functions: The following functions are provided in the Real Statistics Resource Pack:
T1_SIZE(d, 1−β, tails, α, iter, prec) = the minimum sample size required to obtain power of at least 1−β (default .80) in a one sample t test when d = Cohen’s effect size, tails = # of tails: 1 or 2 (default) and α = alpha (default = .05).
T2_SIZE(d, 1−β, tails, α, nratio, iter, prec) = the minimum sample size required to obtain power of at least 1−β (default .80) in a two sample t test when d = Cohen’s effect size, tails = # of tails: 1 or 2 (default), α = alpha (default = .05) and nratio = the size of the second sample divided by the size of the first sample (default = 1).
Here iter = the maximum number of terms from the infinite sum (default 1000) and prec = the maximum amount of error acceptable in the estimate of the infinite sum unless the iteration limit is reached first (default = 0.000000000001).
In the two-sample case, only the size of the first sample is returned. If the two samples don’t have the same size, you can specify the size of the second sample in terms of the size of the first sample using the nratio argument. E.g. if the size of the second sample is half of the first, then set nratio = .5.
If you set nratio to be a negative number then the absolute value of this number will be used as the sample size of the second sample. E.g. if nratio = -50, then the T2_SIZE function will find the size of the first sample assuming that the second sample has 50 elements.
Examples using functions
For Example 1, T2_SIZE(.4) = T2_SIZE(.4, .8, 2, .05, 1, 1000, 0.000000000001) = 100. T2_SIZE(.4, .9) = 133, which is consistent with the fact that a larger sample is required to obtain higher statistical power. Also T2_SIZE(.4, .8, 1) = 78, which is consistent with the fact that a one-tailed test requires a smaller sample. We also see that T2_SIZE(.4, .8, 2, .025) = 121. This is consistent with the fact that a lower value of α requires a larger sample to achieve the same power. T2_SIZE(.3) = 176, which is consistent with the fact that a larger sample is required to detect a smaller effect size.
Finally, T1_SIZE(.4) = 52, which is consistent with the fact that a paired sample test requires a smaller sample to achieve the same power.
Examples Workbook
Click here to download the Excel workbook with the examples described on this webpage.
References
Zar, J. H. (2010) Biostatistical analysis 5th Ed. Pearson
Faul, F., Erdfelder, E., Buchner, A., & Lang, A. G. (2009). Statistical power analyses using G*Power 3.1: Tests for correlation and regression analyses. Behavior Research Methods, 41, 1149-1160.
UCLA Statistical Consulting Group (2021) Power analysis for two-group independent sample t-test | G*Power data analysis examples
https://stats.oarc.ucla.edu/sas/modules/introduction-to-the-features-of-sas/
Wikipedia (2025) Power (statistics)
https://en.wikipedia.org/wiki/Power_(statistics)
SAS (2025) Determining required sample size for a two-sample t test
https://documentation.sas.com/doc/en/statug/latest/statug_power_gettingstarted02.htm
A study is being developed to examine the effects of an anti-allergic eye drop. In the initial visit, subjects will be exposed to an allergen that causes an allergic reaction. In a second visit, participants are again exposed to the allergen, although this time they have been treated with the anti-allergic eye drop. The outcome is change in redness. Each subject will have two scores. One for the placebo eye and one for the treatment eye. A paired samples t test will be used to test whether there is a difference in the change in redness for the two eyes. In a pilot study, the mean difference between change in the treatment eye and change in the placebo eye was .5 (sd=.8), where the treatment eye had a greater reduction in redness. Using the pilot data on the mean difference, we expect the mean difference to be .5 in the main study. How many subjects are needed to have a 90% chance of finding a significant difference between the two eyes using a two-tailed 5% significance level? b. How many subjects are needed if power is reduced to .80?
Jorge,
You can use the pilot study to provide an estimate of effect size (e.g. Cohen’s d). See
https://www.real-statistics.com/students-t-distribution/paired-sample-t-test/
You can then use this effect size to estimate the sample size required to achieve a statistical power of .80, .90, or any other value. See
https://www.real-statistics.com/students-t-distribution/one-sample-t-test/
https://www.real-statistics.com/hypothesis-testing/real-statistics-power-data-analysis-tool/
Charles
Hi, my group has insisted on doing t-tests and ANOVA between the averages of 3-5 trials of binary data (n=50 per trial). So while the average of each trial is not binary, since it’s a percentage of “success”, the individual trials comprise binary values. One of the issues I have with this is that the “real” n is not actually 3-5, it’s 150-250, so the t-test will only report significance if the effect is enormous (which it often isn’t). I have suggested using Fisher’s exact test for each trial as well as for the combined trials (since we try to keep n consistent), however the variance between trials in “success” percentage can be really high (like, success rates between 5 and 25%). We also can’t do multiple comparisons using contingency data — so success rates of 2 treatment groups and the control are not comparable like they are with ANOVA packages. I don’t know if it’s even relevant to do ANOVA with multiple comparisons instead of just a series of Fisher’s tests between each group — the standard deviation as calculated with Browne-Forsythe is sometimes significantly different.
My questions are:
1. What would be the appropriate test for these data constraints?
2. Is a sample size of 50 for binary data with such high variation reliable?
Thank you
Hello Andrea,
1. If you are comparing the averages, then the t test with 2 samples or ANOVA with more than 2 groups is entirely appropriate provided the assumptions are met. The sample size in this case is 50. Note that you can’t use a test with a sample of 150-250 since in this case the sample elements won’t be independent of each other.
2. I don’t know what you mean by “reliable”. The issue in these sorts of tests is whether the sample size is large enough to obtain the desired statistical power based on the effect size that you expect to need to detect. This is a subject that is discussed on the Real Statistics website.
Charles
Hi Charles, thank you so much for responding and sorry for the delay. I think I’ll focus on one question for now:
Essentially, what we want to know is the statistical difference between genotypes, treatments, and genotypes x treatments in the proportion of individuals who have a particular categorical phenotype. For individual trials, I have been using Fisher’s test for significance between genotypes or treatments. However, as we try to independently replicate every experiment 3–5 times, and since, as you said, you can’t just pool the samples from each trial and do a contingency test on that, most of the group just do a t-test (or ANOVA when they have multiple genotypes or tx) using the means from each trial. My concern with this is that the t-test as used by our current stats package (GraphPad) interprets 3 trials as a sample size of 3 rather than a sample size of 50 for each trial. So small effect sizes produce very insignificant p values, irrespective of using 50 or 1000 animals per trial. Furthermore, even in the control genotypes the variability between trials can be high enough that even larger effect sizes are diluted to insignificance. With only 3–5 biological replicates, tests for normality are also often deficient, although hopefully that is balanced by our having equal sample sizes? And, while GraphPad does let you do t-tests/ANOVA using means and sample sizes, it also requires standard deviations, which binary data don’t produce.
What I was hoping to understand from reading through your site was whether there exists a way to manually calculate significance (we don’t have any other stats packages and no one knows R) for the composite of multiple trials of categorical data. Since my labmates have been using GraphPad t-tests/ANOVA between trials, they regularly get high p values and just discard those experiments as biologically insignificant and uninformative, and I don’t know enough to convince them that, should they do a contingency test on a single trial instead, they might see significance more in line with what their raw data suggests. And even if they do find a trial is significant, or that *all* their trials are significant, I have no recommendation as to how to represent that graphically or with significance values.
I’m also becoming concerned that the substantial between-trial heterogeneity within a genotype warrants random-effects modeling to make our inferences from sample size to population more accurate, and that we will thus need to consider GLMM frameworks unsupported by our current software. I have never taken a stats class, though, so it has been difficult to teach myself the relevant information or even recognize examples that could be applied to my issues, so I very much appreciate your timely and succinct answers to my questions!
Mr. Zaiontz,
My company is using the Excel t-test unequal variance for a population of 3 and I am doubting that this is large enough to produce valid results.
What are your thoughts>
It is not large enough to produce any meaningful results.
Charles