Basic Concepts
The power of the goodness of fit or chi-square independence test is given by
![]()
where F is the cumulative distribution function (cdf) for the noncentral chi-square distribution χ2(df), xcrit is the χ2(df) critical value for the given value of α and λ = w2n = χ2 is the noncentrality parameter where w is the φ effect size (see Chi-square Effect Size), even for contingency tables that are not 2 × 2.
Power
Example 1: Calculate the power for Example 3 of Goodness of Fit.
The power of this test is 23%, as shown in Figure 1.
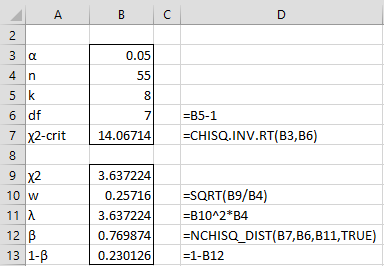
Figure 1 – Power of goodness of fit test
We can use the CHISQ_POWER function to achieve the same result, namely CHISQ_POWER(B10,B4,B6) = .230126.
Worksheet Functions
Real Statistics Functions: The following worksheet functions are provided by the Real Statistics Resource Pack:
CHISQ_POWER(w, n, df, α, iter, prec) = the power of a chi-square goodness of fit or independence test where w = Cohen’s effect size, n = the sample size, df = degrees of freedom, and α = the significance level (default = .05).
CHISQ_SIZE(w, df, 1−β, α, iter, prec) = the minimum sample size required to obtain power of at least 1−β (default .80) in a chi-square goodness of fit or independence test, where w = Cohen’s effect size, and α = the significance level (default = .05).
Here, iter = the maximum number of terms in the infinite sum that will be calculated (default 1000), and prec = desired level of accuracy of the power calculation (default 0.000000001).
Sample Size
Example 2: How big a sample is required to detect a medium effect size (i.e. w = .3) with power of 80% for a chi-square test of independence for a 3 × 3 contingency table?
We can use Excel’s Goal Seek capability as shown in Figure 2.
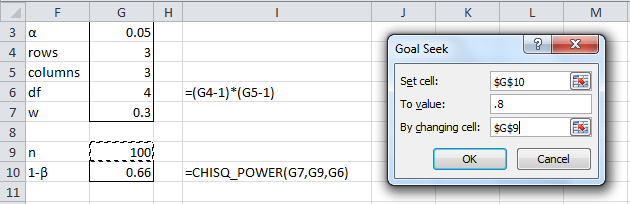
Figure 2 – Using Goal Seek to find the sample size
Upon pressing the OK button, the value in cell G10 changes to .80 and the value in cell G9 changes to 132.6031. Thus, a sample size of 133 is required.
The sample size requirement can also be obtained using the Real Statistics formula
=CHISQ_SIZE(.3,4,.8,.05)
Examples Workbook
Click here to download the Excel workbook with the examples described on this webpage.
Links
↑ Chi-square and F distributions
References
Lowry, R. (2023) The power of the chi-square “goodness of fit” test
http://vassarstats.net/chi_beta.html
Faul, F., Erdfelder, E., Buchner, A., & Lang, A. G. (2009). Statistical power analyses using G*Power 3.1: Tests for correlation and regression analyses. Behavior Research Methods, 41, 1149-1160.
http://link.springer.com/article/10.3758/BRM.41.4.1149
STAT (2015) Power and sample size reference manual, release 13
http://www.stata.com/manuals13/pss.pdf
I can’t get either of the chisq_power and nchisq_dist functions to appear in my spreadsheet. Are these archaic or are they functions that we have to construct ourself? If so, could you please point me to the links showing how to do so?
Hello Adam,
You need to install the Real Statistics software to access these functions. The software is free and you can download it from
https://real-statistics.com/free-download/real-statistics-resource-pack/
You need to follow the installation instructions on that webpage after you download the file.
Charles
Hi Charles,
I have read that you can only use Cramer’s V and ORs for tables larger than 2 x 2 (eg https://www.ncbi.nlm.nih.gov/pmc/articles/PMC5426219/). If so, your power calculations using W could only be used for 2 x 2 chi square tests. Is that the case?
Thank you!
Belinda,
The w effect size is not really the best effect size to use, but it is the one typically used to calculate the power or sample size. The calculate applies to contingency tables larger than 2×2.
Charles
Hi,
I am also confused because when I calculate the sample size I would have required, your algorithms say I need 130 and 187 respectively to achieve a power of .8 for an effect size (w) of .3 and an alpha of .01. However, when I calculate power post hoc, it says that my power is insufficient, even though I have a sample size of up to 400 participants.
Thank you!
Belinda,
I used the Real Statistics Statistical Power and Sample Size data analysis tool and found that
The sample size required for a chi-square test of independence with w = .3, alpha = .01 and power = .8 for a 2×2 contingency table is 130.
The sample size required for a chi-square test of independence with w = .3, alpha = .01 and power = .8 for a 3×3 contingency table is 187.
I don’t know which post-hoc test you are referring to and what tool you used to determine that a sample of size 400 is not sufficient. Please explain in more detail.
Charles
I meant post-hoc, not a priori. Sorry for the confusion!
Thanks for your help.
This comment was meant for the conversation below. Sorry! Too many things going on…:)
Insufficient power in post-hoc despite having required sample size simply means that your effect size is nominal, i.e. there are no statistically significant differences between the two mixtures.
Hi Charles,
I am confused about these power calculations. It was my understanding that when calculating power you set the alpha level, the effect size (eg w=.3) and the sample size, and then calculate power. However, your power calculations calculate the effect-size from the observed data. How come you do this?
Thank you!
While it is true that given the sample size, power and alpha, you can determine the minimum effect size that such a test can support, I don’t see where this is what is done on this webpage. Here, size refers to sample size, not effect size.
Charles
Hi Charles,
Perhaps I need to explain in more detail. Your plug in calculates W from the data, rather than setting W at a medium effect size (?around .3) in order to calculate the power apriori from your sample size for a given alpha level of .01. Does that make more sense? So my question is, why do you calculate effect size from the data when calculating the power a priori, rather than telling the program what effect size you want to calculate your power for?
Thank you
Belinda
I meant post-hoc, not a priori. Sorry for the confusion!
Thanks for your help.
Hello Belinda,
To estimate the sample size, you fix effect size w, power and alpha in advance and then calculate the sample size required to identify an effect of w or more. This is the a priori version.
Once you know the effect size from the data, you can calculate the power based on the alpha value and sample size and effect size from the data. This is the a posteriori version.
Charles
Hi Charles,
Forgetting about my other replies, if I was to substitute w in the =chisq_power function with .3 (a moderate effect size for w), instead of the effect size calculated from my data (at B10 in your example above) would that solve my problem (ie allow me to calculate power with a set effect size rather than deriving the effect size from my data)?
Thank you!
Charles,
Quick question: Why do we need to calculate lambda to determine power for a chi-square test when lambda, in your example and mine, equals the chi-square value?
Ed
Hi Charles,
I want to do a sample size calculation for 3 groups and 2 outcomes, so a 2×3 table, with the chi-square independence test. However, the newest version of excel doesn’t recognize the formula CHISQ_SIZE. We were able to calculate the sample size of a Goodness of fit via another application. Can we use this value also for an independence test, or does it differ?
Hello Maud,
CHISQ_SIZE is not a standard Excel function. It is available only when you install the Real Statistics software, which is free to download.
Charles
Hi again,
I mean power and sample size option under the miscellaneous tools actually. Can ı use it to calculate sample size for a chi square test of crosstab in 2×3 or 3×5 format. Besides, given that ı got a result like 150 samples. It means 75 samples for per groups if ı have 2 groups to, right?
Thanks for reply!
Hello Mert,
The formula will work for the chi-square independence testing of any size contingency table.
The sample size is the total number of elements in the sample (150 in your example), not the elements in each group.
Charles
Hello Charles,
First of all, thank you for your pack!
ı wanna be sure about one point. Can ı use this formula for crosstabs like 2 x 3 or 3 x 5 . Or is it just for chi-square goodness of fit and 2×2 crosstabs??
Thanks again!
Greetings from Istanbul
Hello Mert,
Good to hear from you. Which formula are you referring to?
Charles
Hi Charles,
This is an extremely useful resource. I have successfully installed your realstats add-on, solver is active (and on the ribbon) added (users\me\AppData\Roaming\Microsoft\AddIns\RealStats.xlam) to trusted locations have been added, but when I enter =NCHISQ_DIST I get a #Name error. I suspect our IT department’s security settings. Excel 2010, version 14.0.7214.5000. Any suggestions?
Peter,
What do you see when you enter the formula =VER() ins any cell?
When you press Alt-TI do you see both Solver and RealStats on the list of addins with check marks next to them?
Charles
Hello,
Same problem on same formula here.
Solver and RealStats successfully installed and showing on the list of addins after having pressed Alt-TI. It worked the very first time after RealStats installation, but it doesn’t seem to work again after re-opening Excel (getting a #NAME? error message on the cell where the =NCHISQ_DIST formula is).
Checked and rechecked my own typing and went over the installation instructions again, but I don’t seem to find the “bug.” Help!
PS: Thank you so much for this free Excel tool!!! It’s invaluable!
Hi Paola,
Thanks for your kind words about the Real Statistics software. Now we need to help to get it up and running again for you.
I checked and this function is working on my computer.
When you type in the formula =VER() do you also get a #NAME? error?
Also, are you sure that you entered =NCHISQ_DIST(… and not =NCHISQ.DIST(… ? I ask becuase I occasionally make this type of mistake.
Charles
Hi Charles,
I’m looking at Figure 1, which I believe is based on “Good Fit 2” Goodness of fit example? (Examples part 1A.xls)
In “Good Fit 2” there are 8 groups (Zones 0,1,2,..7) and the total samples in all groups is 55.
In power calculation, you write that “n = the sample size”
In Figure 1, n=8 which is the total number of groups.
Shouldn’t n be 55 as accumulate sample size in all groups , instead of 8 as the number of groups?
(or do I mixed independent examples …)
Thanks,
Oren
Oren,
Thanks for catching this mistake. The number of categories is 8, but the sample size is 55. I have now corrected the webpage. Note that the answer is the same since lambda is equal to the chi-square statistic in any case.
I appreciate your help in improving the accuracy of the website, which in turn makes it easier for the reader to understand the content.
Charles
Hello, Charles and thank you for your website and the statistical tools!
I need help with the calculating the power of a Chi-square analysis.
My data set is 2×2 with 213 subjects.
The Chi-square analysis shows df=1, pearson’s chi-sq = 1.1518202, p-value = 0.217892, x-crit = 3.841459, sig = no, Cramer V = 0.084426, and Odd’s Ratio = 0.52778.
I’ve put these numbers in example NCHI2 to calculate the power of the test.
— Using Power for Goodness of Fit, n=213 and chi-2 = 1.1518202 (from above), then the power is 0.058481 (6%)
— Using Sample Size for Independence Test with w=0.084426 (from the Power for Goodness of Fit) and n=213, then 1-b = 0.23 (23%).
Which represents the power? Did I use the wrong example? Am I missing something fundamental here?
Wishing I’d studied it in school,
J.
John,
As described on https://real-statistics.com/chi-square-and-f-distributions/effect-size-chi-square/, you need to calculate w = sqrt(chi-sq/n) = sqrt(1.1518202/213) = .07353643.
If you use the Real Statistics Statistical Power and Sample Size data analysis tool with the Chi-square option, then you set Effect Size = .07353643, df = 1, Sample Size = 213, you get power = 18.88%.
Charles
Thank you, Charles!
Hi Charles,
Thanks for putting these tools together.
I have two sets of data. First set is generated by a machine (Oi) and the second is manually calculated (Mj). I know log(Oi/Mj) ~N(0, c^2/Mj). I need to measure the c^2. Can I use goodness of fit to calculate the sample size required for that?
Any comment on that is greatly appreciated.
Reza
Reza,
You should be able to estimate c from the sample using a goodness of fit approach, but I don’t understand the part about sample size. Not sure what statistical power would mean in this case.
Charles
Charles
Hope you are well.
I’ve been looking at your site recently to solve a problem regarding the calculation of the power of a chi-square test. I have reproduced your results above in Excel 2016 but I am having problems understanding the implementation for the calculation of the BETA term in cell B11 of example 1. I do understand that this may be complicated but would you be able to point me in the right direction.
Regards
Glyn
Glyn,
It is not complicated at all. Perhaps it would be easier to look at the situation for the t test, where I believe that I explained things in a little more detail. See the following webpages:
https://real-statistics.com/students-t-distribution/noncentral-t-distribution/
https://real-statistics.com/students-t-distribution/statistical-power-of-the-t-tests/
Charles
Charles
Thank you for your quick response
All sorted now – excellent!
Glyn
Hi
The problem I have is that I want to use the standard Excel 16 functions to calculate the value of Beta in Cell B11 rather than use your NCHISQ function.
Glyn,
You may be able to figure out how to get an approximate answer using the relationship between the normal and chi-square distributions, but otherwise I think that you need to use the noncentral chi-square distribution, which is not supported in standard Excel.
Charles
Hi Charles,
This looks so useful! However, I can’t seem to install it. I’m using Excel for Mac 2011 (14.6.8).
The only Add-On available to me is ‘Solver.xlam’ and there is no option to browse for other Add-Ons. Cmd+M minimises the screen and Ctrl+M seems to do nothing at all.
Are you able to advise at all?
Many thanks!
Martine
Problem solved! Thanks very much for this useful tool.
May I ask: if I’ve calculated sample size based on a chi-square test of independence (2×2), is it safe to then analyse the data using binary logistic regression? Or is a different sample size calculation required for the latter?
Thank you again!
M
Hi Martine,
What did you do to resolve the problem?
You would need to provide additional information before I am able to answer your question about whether to use binary logistic regression.
It is very likely that the sample size requirements for the chi-square test is different from that for binary logistic regression.
Charles
Hi Charles,
I just posted a reply, but I don’t think it worked, so I’ll try again. Apologies if you receive two!
I can’t recall how I solved the installation problem in the end. I do recall that it was something very silly on my part.
I asked whether it was safe to analyse my data using binary logistic regression, having calculated sample size based on a chi-square test for independence (2×2). You asked for further details. Here they are:
My design is experimental: participants are randomly assigned to one of two groups. My outcome variable is binary: responses are coded 0 or 1. I’d like to know whether a response of ‘1’ is more frequent (or more likely) in one group than in the other. That is, I’d like to know the effect of group (IV) on response (DV: 0 or 1). So I’d like to use binary logistic regression to assess this.
And my question is: if I’ve calculated sample size based on a chi-square test for independence (2×2), is it safe to analyse my data using binary logistic regression? Or should I rather calculate sample size based on binary logistic regression?
Many thanks again!
M
Martine,
You should calculate the sample size based on binary logistic regression.
Charles
Martine,
You need to install the software before trying to use it. When you type the formula =VER() into any cell in a blank Excel spreadsheet what do you see? If you don’t see a version number then the software has not been installed. To install the software you need to do more than simply download it. You need to follow the instructions on the webpage from where you downloaded the software.
Charles
Something bothers me and bothers me a lot: When we consider computing the “power” of some Chi Squared test is it not a fact that the calculation (even if concealed inside the software of the best stats program) of “power” for any Chi Squared test is always obligated to use OBSERVED DATA (i.e. after the experiment is already over with) to generate what is perceived as the “power value”? But, is this not a species of Post Hoc Power Value ???
Yes, you are rights about this, not just for the chi-square test, but many other tests as well.
Charles
Then I do not see how the “power calculation” for any chi-square test could possibly be useful for DESIGNING an experiment (i.e. picking optimum “sample size”), since computing the value of such “power” would require ipso facto that the investigator knows what his/her outcome data will be BEFORE an experiment is ever run. In other words, an investigator would need to be clairvoyant.
What you are talking about in these posts is the entity called “observed power”. Since it can only (and obviously) be computed AFTER an experiment is completed, to talk about such “power values” in the context of planning experiments sure does seem to be absolutely pure gibberish to me.
Please clear the fog up here. Language is powerful.
Thanks.
James,
Yes, when you compute power, it is the observed power.
The situation is different when you try to estimate the sample size, this is before the experiment. It works like this. Before the experiment, (for any given power and alpha goals that you have) you need to decide on how small an effect you need to detect. If your expectation is that the alternative hypothesis is really correct and by a large amount, then you base the effect size you use on this amount to estimate the sample size that you will need. If it turns out that after running the experiment, the effect size is much smaller than this value, then you will see that the power is smaller than you would have liked (because the sample size you used was too small).
If you decide in advance that you need to detect a small effect (or just to be on the safe side you want to be sure you can detect a small effect), then you use this value for the effect size to calculate the sample size required.
Charles
Hi Charles,
So you say that after making the experience, you should look at the observed power??
For example,
The mean length of bolts …should be 60±1 mm.
you plan a test that will identify 1mm length change with a probability of 0.4.
So the power of the test is 0.4.
Now you run the test, and you found a change of 0.9mm in the length
If you would calculate the power based on 0.9mm is 0.7.
How will you report it?
you accept the hypothesis zero that the mean length of the bolts is bigger than 61 or smaller than 59, with a power of 0.4 ? or with power 0.7?
Thanks,
Oren
Oren,
Generally, if you perform power analysis prior to collecting data, you do it to determine the sample size needed to achieve a specific power goal based on the effect size that you expect.
Once you have collected the data and run your statistical test, you use the the output from the test to determine what statistical power was achieved. The outputs from the test that are used to calculate power are: sample size, alpha value and effect size (i.e. the effect size actually measured).
For your particular problem, what are the values of the sample size, alpha value and effect size?
Reporting is easy. Just add to the rest of the report (that already should include the sample size, alpha and effect size), the phrase “the statistical power achieved was xx%” or something similar.
Charles
Charles,
The power of a test is: “the ability to reject incorrect H0”.
If you plan a test with alpha=0.05 with a required effect of 0.6 and prior power of 0.8.
In this example, there was an infinitely minor change in the average and actual effect is 0.00001
So the prior power is 0.8
and the after power is ~0.05
The ability of the test to reject incorrect H0 per required effect was 0.8, not 0.05
0.05 is the power of the test to identify an effect of 0.00001
Why do we ignore the required effect and prior power? and reporting only the after results.
Thanks, Oren
Oren,
If I understand the situation correctly, you predict the power to be .8 based on an effect size of .6. Thus you have established a sample size which will enable you to achieve power of 80% provided the effect size is at least medium to large, namely .6. Now if you really need to detect an effect size which is much smaller (and therefore harder to detect), you will need a much bigger sample size to achieve power of 80%. If instead the sample size is not increased, then the power achieved will be lower.
Now, once you have conducted the experiment you find that the effect size is really only 0.00001. This is a very very small sample size and so if you used a sample size that was capable of detecting an effect of size .6, then this sample size will only allow you achieve a much smaller power. In fact with such a small effect size, the power is only 5%, which is theoretically the smallest you can achieve.
The a priori calculation, helps determine the sample size required (provided you have estimated the effect size properly). The a posteriori calculation is used to determine the power actually achieved. If you estimated the effect size correctly (a priori) then you will achieve power of 80%. If not then the power achieved will be different. Once you have completed the experiment your a priori power estimate doesn’t serve any purpose.
Charles
Thanks Charles,
This was only “edge” example to explain why I think the priori power is the one that describes better the power of the test, doesn’t matter what will be the test results.
a powerful will not reject H0 if there is nothing to reject, and this doesn’t make the test less powerful.
the observed power (retrospective) is something else, this is the power of the test to reject the “observed effect”
but you already decided before conducting experiment what effect need to be identified.
I don’t say it is meaningless but I think it is less important.
On the other hand, as you explained before, the “observed effect” is very important, we may reject H0 but the observed effect is meaningless
I found the following article, with I believe has a similar opinion: http://daniellakens.blogspot.com.au/2014/12/observed-power-and-what-to-do-if-your.html
What is your opinion?
Thanks,
Oren
Oren,
Thanks for sending me the article. It does seem persuasive.
Charles
Hello Charles,
I have problems to calculate the beta respectively the power of the X²-Test. In the statistic tools (statistical Power and Sample Size; Chi-square test) I have the message “Compiler Error in Modul: frmPower …..”
And with the functions CHISQ_POWER and NCHISQ_DIST i have the Error: Error in Compiler: Projecr or libary not found.
Can you help me ?
Maximilian,
A possible cause is that Excel’s Solver is not active. Please press Alt-TI and see whether Solver is on the list of addins with a check mark next to it. Solver is now required to use the Real Stats software.
Charles
Hi Charles,
In the CHISQ_POWER function you say w should represent Cohen’s D, but the use of this statistic is not used anywhere in the section on the Chi-Square distribution.
Do you mean we should use the Pearson’s V statistic in its place?
Thank you.
Jonathan,
Cohen’s w is the phi coefficient, as defined on the webpage Chi-square Effect Size.
Charles
I am doing something incorrect. trying to determine minimum sample sizes for two chi square tests of independence
Both will have power equal to 0.80, alpha equal to 0.05, 3 columns, and w equal to 0.3.
One has 4 rows the other 10.
Regards,
Bill
Bill,
What answer are you getting? Are you using the Statistical Power and Sample Size data analysis tool?
Charles
Hi Charles,
Would this sample size calculation be valid even if it implies that the expected number of events in some cells will be less than 5, or even zero, due to the low frequency of each variable in the sample?
How to account for this?
Hi Kelvin,
This sample size calculation should be valid if the chi-square test itself is valid. If a relatively small percentage of the cells are 2, 3 or 4, there shouldn’t be a big problem, but I wouldn’t have too much faith in the test if there are cells with 1 or 0. With such samples I would use the Fisher Exact Test if available, although currently I don’t provide an estimate for power. I currently support for the Fisher Exact Test for 2×2, 2×3, 2×4, 2×5, 3×3 and 3×4 contingency tables, depending on how big the sample is.
Charles
Thanks, Charles. Unfortunately the frequencies are too low for the ChiSq test (below 5), while Fisher test only applies to 2 variables, so still not sure how to test low frequencies between multiple variables, or if this is even possible.
You say “Cohen’s φ”, but that doesn’t exist. Do you mean the phi coefficient (https://en.wikipedia.org/wiki/Phi_coefficient) or, Cramer’s Phi (https://en.wikipedia.org/wiki/Cram%C3%A9r's_V_%28statistics%29), or Cohen’s w (https://en.wikipedia.org/wiki/Effect_size#Cohen.27s_w)? The phi coefficient is only defined for 2×2 tables and isn’t suitable for goodness-of-fit 1xk tables. Cramer’s phi is, but requires tables to determine the significance of the effect size. I’m not familiar with Cohen’s w, but it looks like the square root of x^2.
Yclept
w = square root of the sum of the values (pi – ri)^2 / pi, where pi = the proportion of “cell” i adhering to the null hypothesis and ri = the proportion adhering to the alternative hypothesis. It then turns out that w = square root of the chi-square statistic divided by the sample size.
This is true for m x n contingency tables as well as 1 x k goodness of fit tables.
As you have correctly suggested, I have replaced the referenced to “Cohen’s φ” by “the phi coefficient”
Charles
Thank you very much.
But I have a question is the sample size calculated is per group or the whole sample?
The sample size should be for the whole sample.
Charles
Hi Charles!
Thank you very much for this resource. I was wondering, is there an alternate function other than NCHISQ_DIST that I can use to calculate beta? I do not have the Resource Pack so I am trying to find an alternative method. I appreciate the consideration!
Best,
-Andrew Vezey
There is no standard Excel function that computes power (i.e. 1 minus beta) for the chi-square tests. You can try to duplicate all the steps that I have described on the website, but this will take a fair amount of work.
Charles
Hi Charles,
Thanks for putting these tools together. They are of obvious value.
I did have a quick question regarding power analysis for chi square. I wasn’t able to easily map what is described here with other formula for calculating power that I have seen talked about (e.g. https://www.amstat.org/sections/SRMS/Proceedings/y2006/Files/JSM2006-000389.pdf). Is there a particular formula or approach that what you describe above corresponds to?
Cheers
Andrew
Andrew,
If I understand correctly, the referenced article describes approximate methods for calculating the power of certain tests without using iterative techniques. I have adopted instead the calculations using noncentral distributions. I believe the methods are quite different, but I plan to investigate further to see whether the results are similar.
Charles
Hello Sir,
Thank you for your website info about chi-square power analysis.
I was wondering if you can help me calculate- How many samples is required to achieve power of 80% for chi square test for independence for a 2×2 contigency table with medium effect size (w-.3)?
I appreciate,
thank you,
Jason
Jason,
You can use the Statistical Power and Sample Size data analysis tool. Click on the Chi-square and Sample Size options. On the resulting dialog box insert .3 for Effect Size, 1 for df and use the defaults for the other fields. When you press the OK button, you will see that the sample size is 88.
Charles
Hi Sir Charles,
I see the mistake I did.
Thanks for your help.
Your website is an excellent resource especially for a novice like me.
Very much appreciated.
Jason