We now describe additional capabilities for polynomial regression provided by the Real Statistics Resource Pack.
Data Analysis Tool
Real Statistics Data Analysis Tool: This type of regression can be performed by the Polynomial Regression data analysis tool as described below.
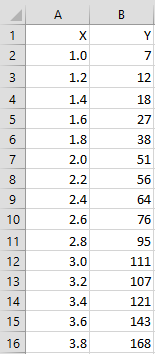
Example 1: Use the Polynomial Regression data analysis tool to create a quadratic regression model for the data in region A1:B31 of Figure 1.
 |
 |
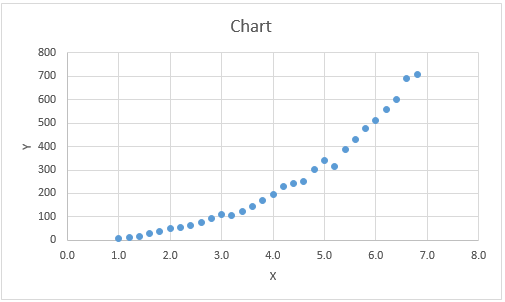 |
Figure 1 – Polynomial Regression data
Press Ctrl-m and select the Regression option from the main dialog box (or switch to the Reg tab on the multipage interface). Fill in the dialog box that appears as shown in Figure 2.
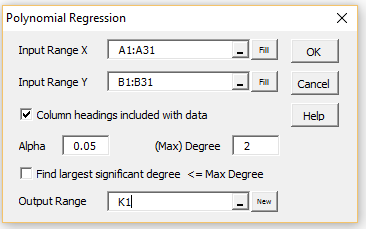
Figure 2 – Polynomial Regression dialog box
Results
After pressing the OK button, the output shown in Figure 3 is displayed.
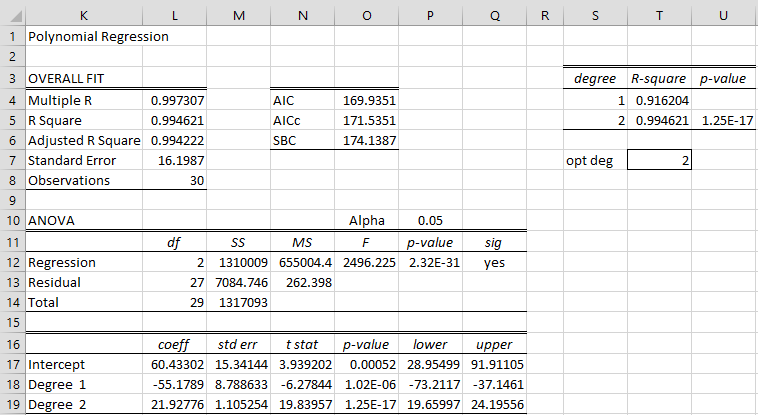
Figure 3 – Output from Polynomial Regression data analysis tool
The regression analysis shown on the left side of the figure is similar to the other regression analyses, with Degree 1 representing the x coefficient and Degree 2 representing the x2 coefficient.
The values in range S3:U7 of Figure 3 show the R-square values for the regression model with and without including the x2 term as well as a measure of how significant the addition of the x2 is. We will describe this part of the output in more detail shortly.
Optimization
Example 2: Find the optimal polynomial regression model for the data in Example 1.
We repeat the procedure from Example 1, except that this time we insert the value 8 in the (Max) Degree field of Figure 2 and check the Find the largest significant degree ≤ Max Degree option. This means that we are seeking the polynomial in x of degree m at most 8 where xm makes a significant contribution to the regression model based on the R-square criteria described in Testing the Significance of Extra Variables. After pressing the OK button, the output shown in Figure 4 is displayed.

Figure 4 – Output from Polynomial Regression data analysis tool
The data analysis tool calculates that the optimum polynomial degree is 3. We see this since only three degrees are shown as coefficients in the output and the value of cell AF13 is 3.
The range AE3:AG11 displays the R-square values for the regression models for polynomials of degree 1 through 8. For each degree value, the corresponding p-value shows whether the regression model for a polynomial with that degree is significantly different from the polynomial with one less degree. As we can see from the figure, the p-values for degrees bigger than 3 are all greater than alpha = .05, and so are not significant. The largest significant p-value occurs for degree = 3 (p-value = 8.39E-05), consistent with the observation we made previously.
Choosing (Max) Degree
We choose the value 8 for the (Max) Degree field for Example 2. This is chosen to be sufficiently high, with a maximum allowable value of 12. Note that with polynomial regression, values can become very large and so can cause an overflow in the calculations, in which case you will receive a runtime error message. In fact, this will happen for Example 2 if the value 12 is chosen. In this case, simply repeat the procedure choosing a lower value for (Max) Degree.
Worksheet Functions
Real Statistics Functions: The Real Statistics Resource Pack provides the following functions where Rx is a column range containing x sample data and Ry is a column range containing y sample data. The first two functions are array functions.
PolyDesign(Rx, deg, ones) – returns an array consisting of x, x2, …, xdeg columns. If ones = TRUE, then the output is 1, x, x2, …, xdeg. The default for ones = FALSE.
PolyCoeff(Rx, Ry, deg) – returns a column array consisting of the polynomial regression coefficients and their standard errors
PolyRSquare(Rx, Ry, deg) = R-square value for the polynomial regression
PolyDeg(Rx, Ry, maxdeg) = the highest degree polynomial ≤ maxdeg which produces a significantly different R-square value
Examples
Referring to the data in Figure 1, we see that =PolyCoeff(A2:A31,B2:B31,3) produces the output in range X17:Y20 of Figure 4. Similarly, =PolyRSquare(A2:A31,B2:B31,3) calculates the value shown in cell X5 or AF6 of Figure 4 and = PolyDeg(A2:A31,B2:B31,8) calculates the value 3 shown in cell AF13. Finally, the array formula =PolyDesign(A2:A31,3) produces the output in range AN2:AP31 of Figure 5 (only the first 15 rows of the output are displayed).

Figure 5 – PolyDesign function
Extracting Columns
We can also use the Extract Columns from a Data Range data analysis tool to create powers of a variable. E.g. for the data in Figure 1, press Ctrl-m and select Extract Columns from a Data Range from the menu. Now enter A1:B31 into the Input Range of the dialog box that appears (as described in Figure 4 of Categorical Coding for Regression) and press the OK button.
Now click on Y from the list box that appears (as shown on the right side of Figure 6) and press the Add Column button. Next, make sure that the Degree option is set to 3 and click on X from the list box and press the Add Power button. The output is as shown on the left side of Figure 6.

Figure 6 – Extract Columns from a Range data analysis tool
Examples Workbook
Click here to download the Excel workbook with the examples described on this webpage.
References
Penn State (2028) Polynomial regression
https://online.stat.psu.edu/stat462/node/158/
Dear Charles,
In your Polynomial Regression Analysis Tool, is it possible to force a quadratic regression to lie at a certain specified fixed point on the x-axis (where y=0)? For instance, in regular Excel it is possible to set the y-intercept (where x=0) to a value of one’s own choice.
Hello Terence,
No, I haven’t implemented this feature in the analysis tool.
Charles
Hi, Charles. I’ve been using your website for years; it’s absolutely terrific. I’d like to use the TREND function, if possible, to calculate (y) and R-squared for polynomial regression. If I square, cube etc. my X-values as you did here, could I do something like =TREND(A1:A100;B1:c100) or TREND(A1:A100;B1:D100) and RSQ(A1:A100;B1:C100) etc. When I do, my answers don’t seem to be correct.
Hi Nancy,
Can you email me an Excel spreadsheet with the data and the results that you are obtaining? I will try to figure out what is going wrong.
Charles
Professor
Thank you for this highly useful tool!
I am unfortunately terribly un-knowledgeable when it comes to statistics, but I am doing my best to learn.
Am I right in thinking that for justifying the use of 1st degree polynomial regression i should add the p-value for degree 1 (as located in figure 1, cell O18)?
Yes, generally for a polynomial of degree n you would include degrees 1 through n-1.
Charles
Hi
Stupid question…..how do I create a regression equation from output that has coefficients through the 7th power? I can obviously see that this solution is optimal for my data, but I want to have a traditional regression equation for prediction. Please help!
Insert 7 in the (Max) Degree field and don’t check the Find the largest significant degree <= Max degree option. Charles
Hello Charles, I have a question. But first of all thank you for all your explanations, it is indeed very helpful!
Could you explain why the p-values in AG3:AG:11 differ from those in AA16:AA20 (Figure 4)? I was doing a polynomial Regression with 3 degrees, whereas the second degree turned out to be the optimal degree…but also in my case the p-values differed from those in the Anova analysis. I was already checking your Anova explanations but I couldn’t figure out why it is different.
Thanks in advance!
Kind regards
Tom
Hi Tom,
The cells in AA are measuring the significance of all the coefficients (0th, 1st, 2nd and 3rd degree) for one specific model, namely the 3rd degree model. The cells in column AG are measuring the significance of the nth degree coefficient only in a model that contains the coefficients 0th, 1st, 2nd, …, nth degree coefficients. Column AG gives this result for n-1 models, not just one.
E.g. cells AA20 and AG6 contain the same value since they both refer to the p-value of the 3rd degree coefficient in the model that contains degreed 0 through 3. Cells AA19 and AG5 differ because they refer to different things: AG5 contains the p-value for the 2nd degree coefficient that only contains coefficients for degrees 0, 1 and 2, while AA19 contains the p-value for the 2nd degree coefficient that contains coefficients for degrees 0, 1, 2 and 3.
Charles
Dear Charles,
I was wondering as to what regression method is used for the polynomial regression tool. Is it simply the method of Least Squares?
Thank you for the useful tool,
Freddy
Hi Freddy,
Yes, it is least squares regression.
Charles
Thank you professor , I have data that contains negative values in both dependent and independent variable so my question is can I use polynomial regression
Thank you
Yes
Hi Charles:
I’ve recently discovered your site, and have found it very informative, especially in the plain-language explanations of what the purpose or interpretation of the steps in, or the results of, processes are.
You have presented, on the https://real-statistics.com/regression/confidence-and-prediction-intervals/plots-regression-confidence-prediction-intervals/ page, a method to graph the confidence intervals, for linear regressions. That process simply uses standard Excel functions. I am working with polynomial regressions, all quadratic. Would the process be similar to the linear-regression approach? If there are differences, could you explain them, or suggest methods to modify the approach for the polynomial case?
Thank you for your assistance.
Quinton
Hello Quinton,
Thank you for your kind words.
The process is the same.
Charles
Dear Charles:
I just downloaded the Real Statistics into the add-ins and the templates.
They all require a password.
Can you please clue me in on this
Loren,
See Password Prompt
Charles
Dear Charles,
I was looking forward a way to perform a polynomial fit and found your site. I have 2 questions:
1. is there a way to get the covariance matrix?
2. does your software provide also the polynomial regression calculation including also the uncertainties (both for “X” and “Y” variables)?
Many thanks and congratulations for your work.
Filippo
Filippo,
1. Suppose that the x data is in range R1 and the y data is in range R2 (without headings). Also suppose that R1 (as R2) has n rows and the degree of the polynomial is k. Highlight an n x k range R3 and insert the array formula =PolyDesign(R1,k). Now highlight a separate k+1 x k+1 range R4 and insert the array formula =RegCov(R3,R2). Range R4 contains the covariance matrix. It is important to press Crtl-Shft-Enter after entering each of these array formulas.
Ideally you should be able to use the array formula =RegCov(PolyDesign(R1,k),R2), but this doesn’t work at present. I will try to fix this in the next release of the Real Statistics software.
Charles
Prof, I am pleased with the analysis of the polynomial regression. theoretically, it is highly understandable. However, I have tried to do it myself on my computer but couldn’t. I could not find where the polynomial regression interface is located in microsoft excel. I humbly request for the procedures so that i can maximixe my learning ability in excel
Thanks.
Folorunso,
This procedure is not provided in standard Excel.
You need to download the Real Statistics software to get this capability in Excel. The software is free and you can download it at
Free Download.
Charles