In most of the statistical analyses that we perform, each row in a range will contain data for a single subject in a sample, and the columns correspond to the variables under study. It will, therefore, be useful to sort data by rows based on a sort key (which corresponds to the heading of one of the columns).
Sorting by Rows
Real Statistics Functions: The following array functions in the Real Statistics Resource Pack are used to sort rows in an array or cell range.
SORTRows(R1, k, head) – returns an array of the same size and shape as R1, which sorts the rows in R1 based on the sort keys consisting of the first k columns of R1 (default 1). If head = TRUE (default FALSE), then the first row of R1 is assumed to contain column headings and is retained as the heading of the output.
QSORTRows(R1, col1, ascend, head) – returns an array with the data in R1 in sorted order based on the elements in column (the “sort key”) of R1. If ascend = TRUE (default), the sort is in ascending order; when ascend = FALSE, the sort is in descending order.
QSORT2Rows(R1, col1, col2, ascend, head) – returns an array with the data in R1 in sorted order based on the elements in column col1 of R1 (the “primary key”). If two rows have the same value in column col1, then these rows are further sorted based on the value in column col2 (“the secondary key”). If ascend = TRUE (default), the sort is in ascending order; when ascend = FALSE, the sort is in descending order.
QSORT2RowsMixed(R1, col1, col2, ascend, head) – returns an array with the data in R1 as for QSORT2Rows, except that if ascend = TRUE (default), then sorting based on the primary key is in ascending order while the sorting based on the secondary key is in descending order, while if ascend = FALSE, then sorting based on the primary key is in descending order while the sorting based on the secondary key is in ascending order.
Additional information
If col1 is omitted, it defaults to 1, i.e. the sort is based on the elements in the first column of R1. If col2 is omitted, it defaults to 2, i.e. the sort is based on the elements in the second column of R1. When head = TRUE, then the first row contains a heading that is not to be sorted; the default is FALSE.
When one of these functions is used in a highlighted range and that range has more cells than R1, the extra cells are filled in with the error value #N/A.
The array or range R1 in QSORT2RowsMixed can only contain numeric data, while R1 in the other functions can contain any alphanumeric values.
All these functions can be used as dynamic array functions with versions of Excel that support dynamic arrays.
Example 1 (one sort key)
Sort the rows in range T3:W14 of Figure 1 based on the elements in its 4th column (i.e. column W). Also, sort the rows in range T3:W14 based on the first column.
The results are shown on the right side of Figure 1.

Figure 1 – Sorting by rows
When there are ties, the original order is used. Note too, that the output in range AD3:AG14 can also be obtained via the array formula =SORTRows(T3:W14).
For users of versions of Excel that support dynamic arrays, you can obtain the results in Y3:AB14 by inserting the formula =QSORTRows(T3:W14,4) in cell Y3 and pressing the Enter key. SORTRows can also be in this fashion.
Example 2 (multiple sort keys)
Sort the rows in range A3:D14 of Figure 2 in descending order based on the elements in its third column (i.e. column C) and then the first column (column A). Also, sort the rows in range A3:D14 (in ascending order) based on the first 3 columns.
The results are shown on the right side of Figure 2.
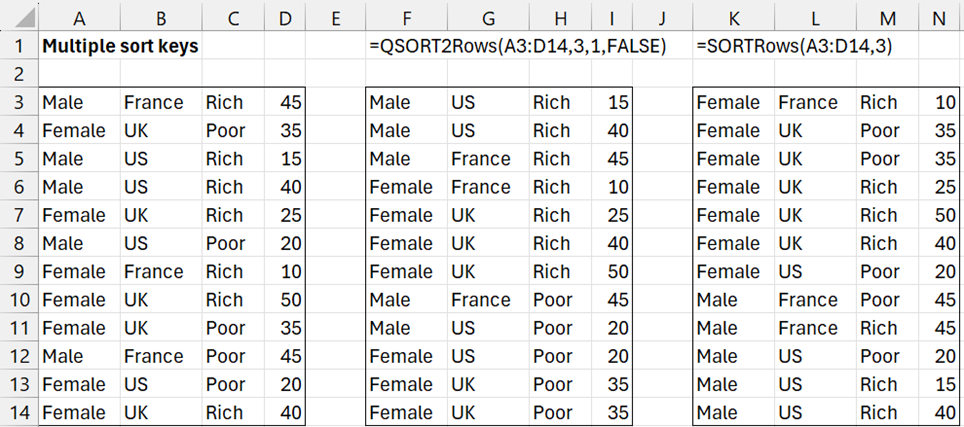
Figure 2 – Sorting by rows with multiple sort keys
For users of Excel that support dynamic arrays, you can obtain the results in F3:I14 by inserting the formula =QSORT2Rows(A3:D14,3,1,FALSE) in cell F3 and pressing the Enter key.
Example 3 (using QSORT2RowsMixed)
Sort the rows in range P2:S14 of Figure 3 based first on the elements in the first column (column P) in ascending order and then by the elements in the third column in descending order.
The results are shown on the right side of Figure 3 using the formula
=QSORT2Rows(P2:S14,1,3,TRUE,TRUE)
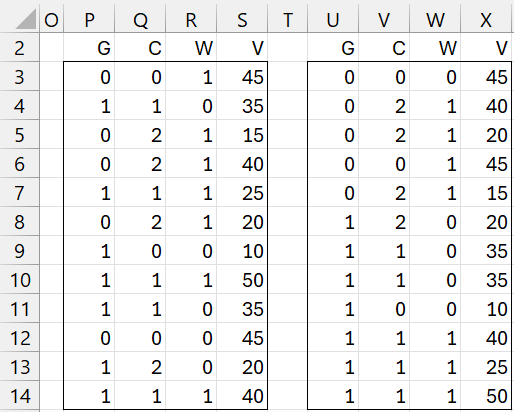
Figure 3 – Sorting using QSORT2RowsMixed
Eliminating Duplicates
The following array functions contained in the Real Statistics Resource Pack are used to sort rows, eliminating any duplicates.
SortRowsUnique(R1, filler) – returns an array with the data in R1 in sorted order, eliminating any duplicate rows; in general, the output should have the same number of columns as R1.
SortRowsCount(R1, filler) – returns an array with the data in R1 in sorted order, eliminating any duplicate rows. An additional column is appended to the output containing counts; in particular, for each row in the output, the last column contains a count of the rows in R1 that match that row in the output.
SortRowsSum(R1, filler) – returns an array with the data in R1 in sorted order, excluding the elements in the last column and eliminating any duplicate rows. For each row in the output, the last column contains the sum of the values in the last column of those rows in R1 that match that row in the output; the output should have the same number of columns as R1.
The string filler is used as a filler when the output has more elements than are needed. This argument is optional and defaults to the error value #N/A.
These worksheet functions can also be used as dynamic array functions with versions of Excel that support dynamic arrays. In these cases, the number of rows in the output is equal to the number of rows in R1.
Example 4 (sorting unique)
Apply the SortRowsUnique, SortRowsCount, and SortRowsSum functions to the data in range A3:D14 of Figure 4.
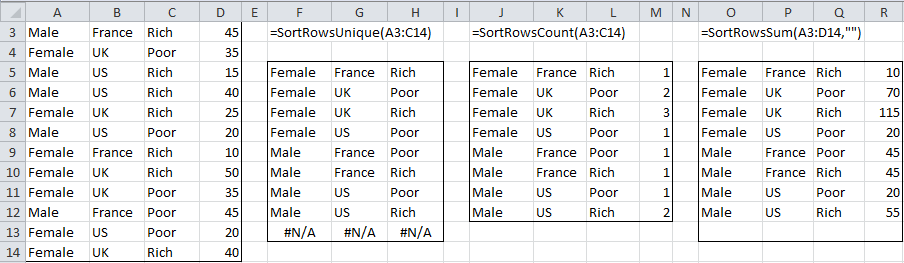
Figure 4 – Sorting unique by rows
Dynamic Array Functions
The following are dynamic array functions (see Dynamic Array Formulas). The difference between these functions and those described above is that the output contains as many rows as unique rows in R1. No filler is needed.
SortsRowsUnique(R1): returns an array with the data in R1 in sorted order, eliminating any duplicate rows; the output should have the same number of columns as R1.
SortsRowsCount(R1): returns an array with the data in R1 in sorted order, eliminating any duplicate rows. An additional column is appended to the output containing counts; in particular, for each row in the output, the last column contains a count of the rows in R1 that match that row in the output.
SortsRowsSum(R1): returns an array with the data in R1 in sorted order, excluding the elements in the last column and eliminating any duplicate rows. For each row in the output, the last column contains the sum of the values in the last column of those rows in R1 that match that row in the output; the output should have the same number of columns as R1.
The following function is also available from the Real Statistics Resource Pack.
CountRowsUnique(R1, head, ncols) = a count of the number of unique rows in R1. If head = TRUE (default FALSE), then the first row of R1 (presumably a heading) is not counted; the last ncols columns of R1 are not considered when determining uniqueness (ncols = 0).
Example 5
Referring to Figure 4, note the following modifications when SortsRowsUnique, SortsRowsCount, and SortsRowsSum are used in place of SortRowsUnique, SortRowsCount, and SortRowsSum when using Excel 365.
If you place the formula =SortRowsUnique(A3:C14) in cell F5 and press the Enter key, the output shown in range F5:H13 will appear; in addition, range F14:H16 will be filled with #N/A. Thus, the output will contain 12 rows, the same number as A3:C14.
If, instead, you place the formula =SortsRowsUnique(A3:C14) in cell F5 and press the Enter key, the output shown in range F5:H12 will appear. This time, only 8 rows will be output, none containing #N/A. This is confirmed by the fact that the formula =CountRowsUnique(A3:C14) yields the value 8.
Similar modifications occur for the other formulas in Figure 4.
Data Analysis Tool
Real Statistics Data Analysis Tool: The Reformatting a Data Range by Rows data analysis tool supplied in the Real Statistics Resource Pack provides an easier-to-use version of the QSORTRows function.
For example, to sort the data in range T3:W14 of Figure 1 based on the elements in its 4th column, press Ctrl-m, and choose the Reformatting a Data Range by Rows option.
Fill in the dialog box that appears as shown in Figure 5 and click on the OK button.

Figure 5 – Dialog box for sorting a data range by rows
The output is displayed as shown in range Y3:AB14 of Figure 1.
Links
↑ Data conversion and reformatting
Examples Workbook
Click here to download the Excel workbook with the examples described on this webpage.
References
Writtenhouse, S. (2022) 7 ways to sort data in Microsoft Excel. How-To Geek
https://www.howtogeek.com/847610/ways-to-sort-data-in-microsoft-excel
Hendrikx, M. and Writtenhouse, S. (2022) How to Remove Duplicate Rows in Excel. How-To Geek
https://www.howtogeek.com/198052/how-to-remove-duplicate-rows-in-excel