Basic Concepts
We now define the concept of probability distributions for discrete random variables, i.e. random variables that take a discrete set of values. Such random variables generally take a finite set of values (heads or tails, people who live in London, scores on an IQ test). They can also take an infinite but countable set of values (e.g. 0, 1, 2, 3, …).
Definition 1: The (probability) frequency function f, also called the probability mass function (pmf) or probability density function (pdf), of a discrete random variable x is defined so that for any value t in the domain of the random variable (i.e. in its sample space):
f(t) = P(x = t)
where P(x = t) = the probability that x assumes the value t.
The corresponding (cumulative) distribution function (cdf) F(x) is defined at value t by
![]()
Thus, F(t) is the sum of all the f(x) for all values of x that are less than or equal to t.
We describe a number of discrete probability distributions on this website such as the binomial distribution and Poisson distribution.
Properties
Property 1: For any discrete random variable defined over the range S with pdf f and cdf F, the following are true.
![]()
![]()
![]()
for all t in S.
Proof: For finite sample spaces, these are characteristics of the probability function P(E) per Property 1 of Basic Probability Concepts. They also hold for infinite discrete sample spaces, but we need not get into the details here.
Observation: If f is the frequency function of a discrete random x with distribution function F, then f(t) is the probability that x takes the value. F(t) is the probability that x takes a value less than or equal to t. Thus, the probability that x takes a value t such that t1 < t ≤ t2 is F(t2) – F(t1).
![]()
Here u1 is the first value in the domain of f which is larger than t1. Such a u1 exists since x is a discrete random variable (usually u1 = t1+1).
You can express a frequency function as a table or a bar chart (see the following example).
Table and Chart of a Discrete Distribution
Example 1: Find the distribution function for the frequency function given in columns A and B of Figure 1. Also, show the graphs of the frequency and distribution functions.
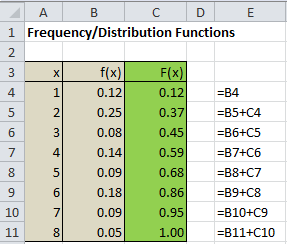
Figure 1 – Table of frequency and distribution functions
Given the frequency function f defined by the table in the range B4:B11, we can define the distribution function F in the range C4:C11 by putting the formula =B4 in cell C4 and the formula =B5+C4 in cell C5 and then copying the second formula into cells C6 to C11 (e.g. by highlighting the range C5:C11 and pressing Ctrl-D).
Using the approach described in Example 1 of Excel Charts, we can generate the graphs of the frequency and distribution functions as follows:
  |
Figure 2 – Charts of frequency and distribution functions
Excel Worksheet Function
Excel Function: Excel provides the function PROB, which is defined as follows:
Where R1 is an array defining the discrete values of the random variable x (e.g. A4:A11 in Figure 1) and R2 is the array consisting of the frequency values f(x) corresponding to the x values in R1 (e.g. B4:B11 in Figure 1), the Excel function PROB is defined as follows:
PROB(R1, R2, c) = the frequency value f(c)
PROB(R1, R2,, c) = the cumulative distribution value F(c)
PROB(R1, R2, a, b) = the probability that x takes a value t between a and b, inclusive, i.e.
![]()
Thus in Example 1, we can put the formula =PROB(A4:A11,B4:B11,,A8) in cell C8, and similarly for the other values in column C. Also
P(3 ≤ x ≤ 5) = PROB(A4:A11,B4:B11,A6,A8)
The use of the PROB function for Example 1 is summarized in Figure 3.
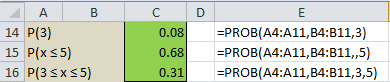
Figure 3 – Use of PROB function
For Example 1 it also follows that P(3 ≤ x ≤ 5) = f(3) + f(4) + f(5) = F(5) – F(2) = 0.31.
Constructing a Frequency Function
Example 2: Determine the frequency function for the data in column A of Figure 4.

Figure 3 – Constructing a frequency function
First, create a list of unique data values. This can be obtained by first copying the raw data scores in column A to a new place in the worksheet (e.g. in column C in the example above) and selecting Data > Data Tools|Remove Duplicates. The highlighted data can then be sorted via Data > Sort & Filter|Sort. The result appears in cell range C4:C8 above.
Alternatively, you can use the Real Statistics array formula =QSORT(NoDupes(A3:A14)). See Sorting and Removing Duplicates. Another approach is to use Excel’s new dynamic array functions SORT and UNIQUE to achieve the same results. See Sorting and Filtering Functions.
Next, use the COUNTIF function (see Excel Conditional Functions) to count how many times each score appears in the sample data. E.g. cell D4 contains the formula =COUNTIF($A$3:$A$14,C4), which has a value of 2 since the data element 12 (the value in cell C4) appears twice in the raw data. Since there are 12 data elements, the correct value of the frequency function for x = 2 is 2/12 = 0.167, which can be calculated via the formula =D4/D$9 in cell E4 where cell D9 contains the formula =SUM(D4:D8).
Real Statistics Worksheet Function
Real Statistics Function: The Real Statistics Resource Pack supplies the following array function to create a frequency function.
FREQTABLE(R1) = an n × 3 array which contains the frequency table for the data in R1, where n = the number of unique values in R1 (i.e. the number of data elements in R1 without duplicates)
To use this function you must highlight an array with 3 columns and at least as many rows as unique elements in R1. You can highlight more rows than you need; any extra rows will take value #N/A. See Frequency Tables for more information about this function.
Example 3: Repeat Example 2 using the FREQTABLE function.

Figure 5 – Using the FREQTABLE function
The output from =FREQTABLE(A3:A14), where A3:A14 is as in Figure 4, is shown in range M4:O8 of Figure 5 (the headings in row 3 have been added manually).
Data Analysis Tool
Real Statistics Data Analysis Tool: The Real Statistics Resource Pack also contains a data analysis tool called Histogram with Normal Curve Overlay. The output is similar to that generated by the FREQTABLE function except that you don’t need to specify the size of the frequency table. The analysis tool sizes the output automatically.
To use this data analysis tool for Example 1, press Ctrl-m and select the Histogram with Normal Curve Overlay option. Fill in the data fields in the dialog box that appears as shown in Figure 6 (leaving the Bin size field blank) and press the OK button. The output is shown on the right side of Figure 6.

Figure 6 – Histogram data analysis tool
In addition to the frequency table shown in Figure 6, the data analysis tool also produces a chart with the same information, as shown in Figure 7.
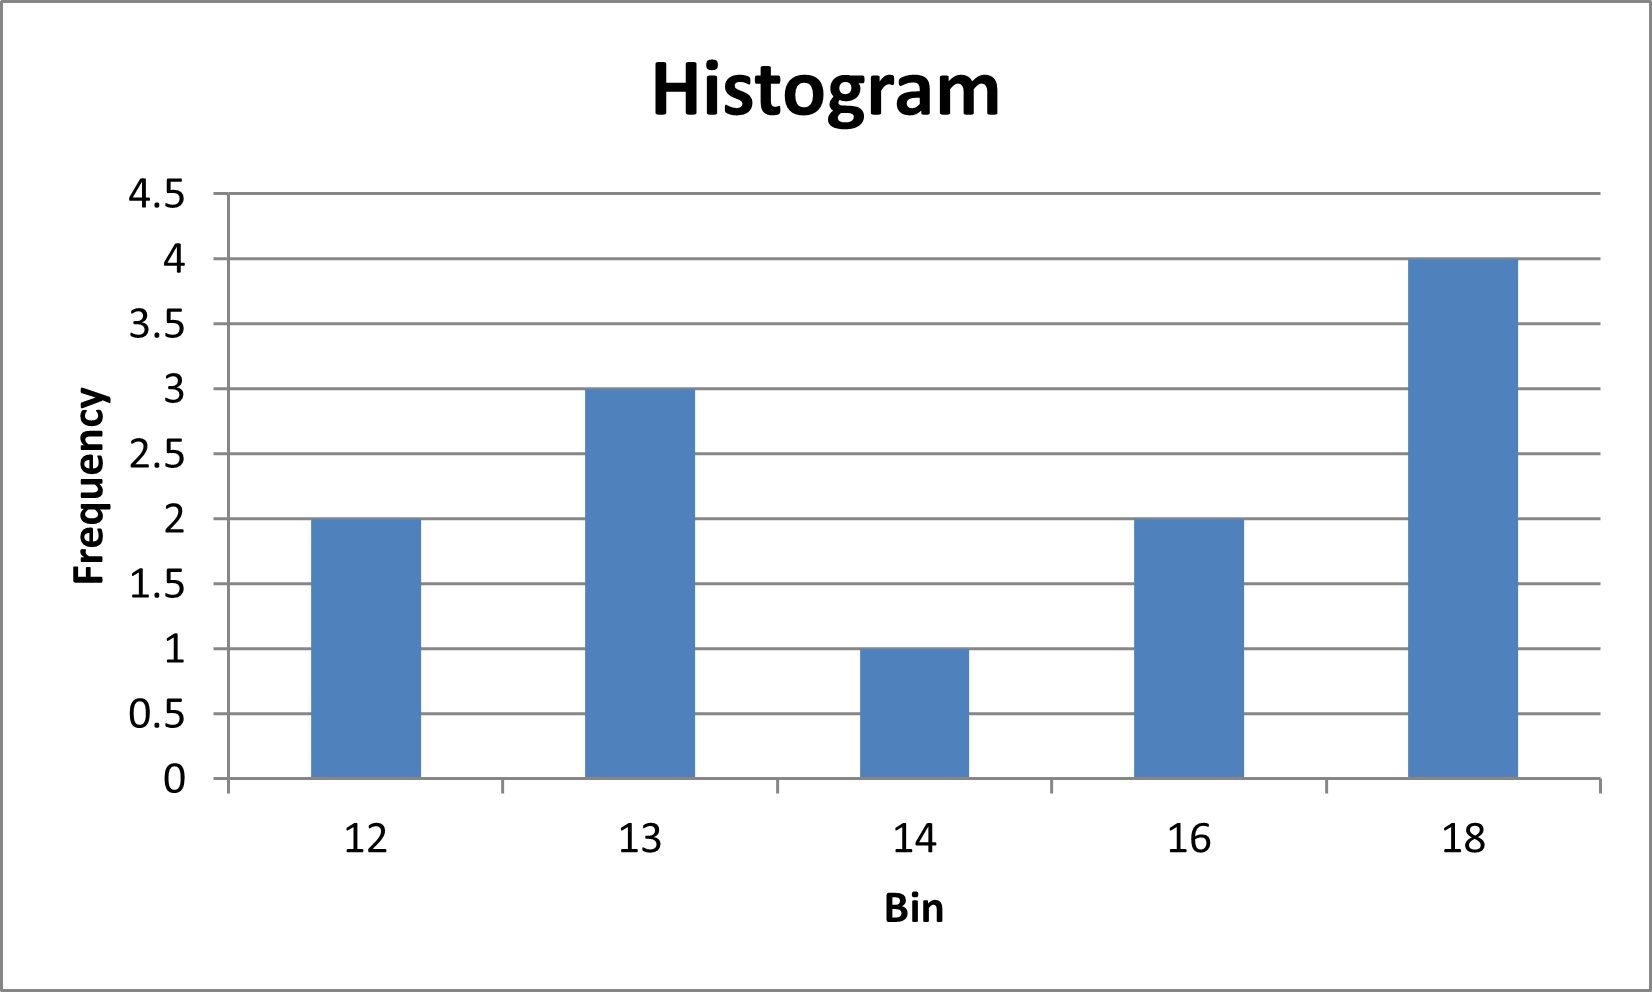
Figure 7 – Chart of the Frequency Table
See Histograms for more examples of the use of the Histogram with Normal Curve Overlay data analysis tool.
Multivariate Distributions
The notion of a probability function can be extended to multiple random variables. We now give the definition for two random variables.
Definition 2: f(x, y) is a joint probability density function (pdf) of random variables x, y if for any values of a and b in the domains of x and y respectively
f(a, b) = P(x = a and y = b)
In this case, the cumulative distribution function is given by

Property 2: If x is a random variable with pdf f and y is a random variable with pdf g, then x and y are independent if and only if the function f(x) ∙ g(y) is a joint pdf for x, y.
Proof: Follows from Definition 3 of Basic Probability Concepts.
Links
Examples Workbook
Click here to download the Excel workbook with the examples described on this webpage.
References
Young, J. (2021) Discrete distribution. Investopedia.
https://www.investopedia.com/terms/d/discrete-distribution.asp
Microsoft Support (2012) PROB function
https://support.microsoft.com/en-us/office/prob-function-9ac30561-c81c-4259-8253-34f0a238fc49
Bass, R. F. et al. (2013) Upper level undergraduate probability with actuarial and financial applications
https://www.math.union.edu/~marianop/MATH3371f19/ProbText.pdf
Navidi, W. (2011) Statistics for engineers and scientists (3rd ed) McGraw Hill
Hi
I am new to this site. I have installed the examples and addin.
I am unable to get the desired output for the FREQTABLE function. I guess it is because I am not doing the “highlight an array with 3 columns” instruction correctly.
I created an array using the Ctrl-Shift- Enter method. I got this output below.
#NAME? #NAME? #NAME?
#NAME? #NAME? #NAME?
#NAME? #NAME? #NAME?
#NAME? #NAME? #NAME?
#NAME? #NAME? #NAME?
#NAME? #NAME? #NAME?
#NAME? #NAME? #NAME?
#NAME? #NAME? #NAME?
#NAME? #NAME? #NAME?
#NAME? #NAME? #NAME?
Can you pl let me know where I am making the mistake?
Anand,
If you are using the FREQTABLE function, you first need to install the Real Statistics software< otherwise Excel won't recognize it as a valid function. Charles
Had already done that. To reconfirm, I checked once again with Alt TI. And Realstat and Solveraddin – both are checked as included.
Is there anything I need to do while starting up so that the Realstat software gets loaded?
Anand,
If RealStats and Solver are both checked, then the software should load automatically. What do you see when you enter the following formula?
=VER()
Charles
Have you done any posts on applying poisson and weibull distribution’s?
Ranjit,
Yes, see the following webpages:
Poisson Distribution
Weibull Distribution
Charles
Wish i had seent his site earlier. The concepts have been so clearly explained here. Better than any teacher i ever had.
Ranjit,
Good to hear. Thank you for your support.
Charles
What kind of probability distribution could you get from the data table that you used. Could you use it for poisson or bimomial?
The data consists of numbers I pulled out of the air. They weren’t intended to follow any specific probability distribution.
Charles
Charles,
Thank you very much for your effort making this great website. I enjoy learning here very much.
I’ve got a problem with understanding the first observation:
P(t1<x<=t2) = ∑ from t=t1 to t2 (f(t))
As I understand the right side equals to f(t1)+…+f(t2) = P(t1<=x<=t2) which is different from the left side. Am I wrong? Maybe it should be written ∑ for t∈(t1, t2]?
Best regards from Russia
Artem,
You are correct. The formula as written is not quite right. I have just revised the formula to correct the error. Thanks for catching this mistake.
Charles
Charles,
It means all 7 books were returned after 23 days all at once.
Thanks,
Kay
Kay,
If x is the random variable = number of days it takes to return a book, then the frequency table can be represented as
days freq pdf cum cdf
3 1 2.3% 1 2.3%
5 5 11.4% 6 13.6%
6 4 9.1% 10 22.7%
8 4 9.1% 14 31.8%
12 5 11.4% 19 43.2%
15 5 11.4% 24 54.5%
16 6 13.6% 30 68.2%
17 7 15.9% 37 84.1%
23 7 15.9% 44 100.0%
Charles
Hello,
Does the data that I use in excel have to follow a normal distribution or any other distribution to be able to use the probability frequency function and cumulative distribution function on my data as described above?
Also,
Are frequencies output with these functions or are they probabilities and what is the distinction if any? Are these functions used merely to analyze the data, or is it used to output probabilities/ frequencies that you are assume will stay true when more time passes and you get more and new data?
Hello Kay,
1. You data does not have to follow a normal or any other distribution. Of course, the data itself will define a distribution, but it may not be any of the commonly used distributions.
2. The output from the PROB function are probabilities. The output from FREQTABLE includes both frequencies and probabilities. If I toss a coin 10,000 times and it comes up heads 5,010 times, then the frequency is 5,010 and the probability id 5,010/10,000. A frequency table is generally used to describe data and may be used for subsequent analysis. There is no assumption that probabilities/frequencies will remain the same as you get more data.
Charles
Charles,
Say you have two columns of data instead of one. The first column, as shown below, has number of books checked out at a library and the second column has the duration in days it took for a person to return that number of books:
# days
1 3
2 5
7 17
7 23
3 5
4 6
5 15
4 8
6 16
5 12
Assume that this is just sample data and that when I calculate, I will have data showing number of days it took for all counts of books (1,2,3,4 ect.)
Could a frequency table still be applied to this above data to show that when a given number of books are checked out, a frequency and probability can be computed in terms of duration in time. In other words, something that says if 7 books are checked out, what is probability that in a given time span 7 books are checked out or less or something like the probability that between 5 and 7 books inclusive are checked out.
I was thinking for each count of books checked out, sum up the total duration they were checkout for and divide that number by the total number of days amongst all counts of books checked out. So in the above example, for 7 books checked out, I would sum up 17 and 23 and divide by the total number of days, 110 to give a probability or F(x) of 0.363, and then I could use the PROB function in excel and do a CDF to see the probability 7 book or less are checked out. I don’t know how frequency would play in here, however.
Kay,
Before trying to organize this information in the form of a frequency table, it would be helpful to understand what sort of questions you are seeking to answer. You seem to say that you want to understand the probability that 7 books or fewer are checked out. Based on the data this seems to be 100% since no person checked out more than 7 books.
Please clarify what your objectives are.
Charles
Charles ,
I agree what I wrote was not clear. First, assume the sample data is from books were checked out in a time span of a month:
I would like to find :
1)During the month of which this data was collected, what range of number books checked out resulted in the books being returned the fastest and what range resulted in books being checked out the slowest amount of time.The choices of ranges of number of books are: 1 book to 3 books inclusive, 4 books to 5 books inclusive, or 6 books to 7 books inclusive. I want to express this in frequencies and probabilities if possible. But if that does not fit what I am looking for, please let me know.
Kay,
When you say, for example, that 7 books were checked out and it took 23 days to return the books, does this mean that all 7 books were returned after 23 days or that the last of the 7 books were returned after 23 days or the sum of the number of days it took to return each book was 23_
Charles
Hi,
Thank you for your articles, they have really been enlightening.
I have a question regarding fitting data to a distribution. I am conducting a study on copulas and the process requires me to have that my data follows a uniform distribution. Do you know how I can do this with the data I have? And is there a way to do this through Excel?
Marian,
Are you trying to (1) test whether your data does follow a uniform distribution or (2) create data that follows a uniform distribution?
If (1) you can use the Kolmogorov-Smirnov test and/or test whether your data is random using a Runs test. See the following webpages:
Kolmogorov-Smirnov test
Runs Test
If (2) you can create random values between a and b with a < b using the formula =a+(b-a)*RAND() Charles
Sir, is there a way on how I can determine the distribution of a certain set of data in Excel? (if it’s normal, poisson, etc)
Rob,
There are quite a number of ways to determine whether data is normally distributed. These methods are described on the webpage:
Testing for Normality
For other distributions you can use the Chi-square Goodness of Fit or Kolmogorov-Smirnov test. These are described on the following webpages:
Chi-square Goodness of Fit test
One Sample Kolmogorov-Smirnov test
Charles
Sir, thanks for the excel add in. Sir, there is one error ‘Compile error in hidden module: Analysis’ comes. How can I solve it?
Regards
A K Sahu
Aatish,
Try entering the formula =VER() in any blank cell in a worksheet. If you get an error, then the Real Statistics software was not installed properly. If you get the release number (e.g. 3.6.2) of the Real Statistics add-in then the cause is different and we will need to diagnose the problem in a different way. In this case, let me know which version of Excel are you using?
Charles
PROB doesn’t seem to like -ve c values (I was using it in the context of portfolio returns) Also, it seems that the c values must be in increasing order in the R arrays, else PROB is not happy. This is assumed in every example I’ve seen but never formally stated, even on Microsoft sites.
Nice site.
Gaylord,
I just tried some examples where the R1 array was not in increasing order, including the case where the order of the x values were 1,3,2,4,5,6,6,8 (in that order), and the results were correct. Can you give an example where PROB did not calculate the correct values?
Charles