Basic Concepts
Definition 1: The Weibull distribution has the probability density function (pdf)
![]()
for x ≥ 0. Here β > 0 is the shape parameter and α > 0 is the scale parameter.
The cumulative distribution function (cdf) is
![]()
Let p = 1 – exp(-(x/α)β). Then 1 – p = exp(-(x/α)β). Taking the natural log of both sides, we get ln(1 – p) = -(x/α)β. Solving for x results in x = α(-ln(1-p))1/β.
Thus, the inverse cumulative distribution function is
![]()
Observation: There is also a three-parameter version of the Weibull distribution. Click here for more information about this version.
Interpretation of Parameters
If x represents “time-to-failure”, the Weibull distribution is characterized by the fact that the failure rate is proportional to a power of time, namely β – 1. Thus β can be interpreted as follows:
- A value of β < 1 indicates that the failure rate decreases over time. This happens if there is significant “infant mortality”. Thus, defective items fail early with a failure rate decreasing over time as the defective items are weeded out of the population.
- A value of β = 1 indicates that the failure rate is constant over time. This might suggest random external events are causing mortality or failure.
- A value of β > 1 indicates that the failure rate increases with time. This happens if there is an “aging” process; e.g. if parts are more likely to wear out and/or fail as time goes on.
Since F(x) is the probability that the time-to-failure is at most x, we can also define the survival function (aka the reliability function) S(x) = 1 – F(x) as the probability of survival for at least x units of time.
1/α can be viewed as the failure rate. Note too that for any values of α and β, F(α) = .63212.
Properties
Defining
![]()
the key statistical properties of the Weibull distribution are:
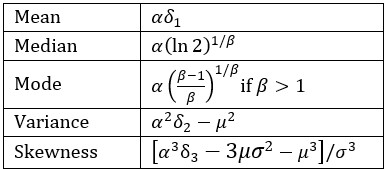
Figure 1 – Statistical properties of the Weibull distribution
Since
![]()
it follows that
![]()
![]()
![]()
![]()
![]()
Graphs
Figure 2 shows how the Weibull distribution changes as values of beta vary and alpha stays fixed.
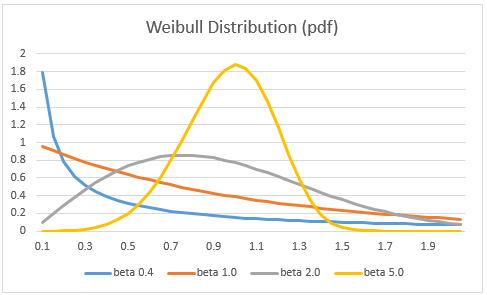
Figure 2 – Chart of Weibull distribution by beta parameter
Worksheet Functions
Excel Function: Excel provides the following function in support of the Weibull distribution where α and β are the parameters in Definition 1.
WEIBULL.DIST(x, β, α, cum) = the pdf of the Weibull distribution f(x) when cum = FALSE and the cdf F(x) when cum = TRUE
This function is not available in versions of Excel prior to Excel 2010. Instead, these versions of Excel use the equivalent function WEIBULL.
Real Statistics Function: Since Excel doesn’t provide an inverse function, you can use the following function provided by the Real Statistics Resource Pack instead.
WEIBULL_INV(p, β, α) = x such that WEIBULL.DIST(x, β, α, TRUE) = p; i.e. the inverse of WEIBULL.DIST(x, β, α, TRUE)
You can use the formula =WEIBULL_INV(RAND(), β, α) to generate a random element from a Weibull distribution with parameters α and β. Alternatively, you can use the Excel formula =α*(-LN(RAND())^(1/β) (based on the inverse cumulative distribution function described previously).
Examples
Example 1: The time to failure of a very sensitive computer screen follows a Weibull distribution with α = 1,000 hours and β = .6. What is the probability that the screen will last more than 5,000 hours? What is the mean time to failure?
The probability that the screen will last no more than 5,000 hours
= WEIBULL.DIST(5000, .6, 1000, TRUE) = 0.92767.
Thus, the probability that the screen will last more than 5,000 hours = 1 – 0.92767 = 7.2%
MTTF = αΓ(1+1/β) = 1000Γ(1+1/.6) = 1000*EXP(GAMMALN(1 + 1/.6)) = 1,504.575 hours
Example 2: If the mean time to failure for a component which follows a Weibull distribution is 1,000 hours with a standard deviation of 400 hours, what is the probability that the component will last more than 2,000 hours?
From Figure 1, it follows that
![]()
![]()
We now solve these equations for α and β. First, we simplify the second equation. Then we take the natural log of both sides of both equations to get
![]()
![]() Eliminating α
Eliminating α
![]()
which is equivalent to
![]()
Using Goal Seek
The above equation takes the form h(β) = 0, which we solve using Excel’s Goal Seek capability by selecting Data > Forecast|What If Analysis > Goal Seek, and filling in the dialog box that appears as shown in Figure 2. For versions of Excel prior to Excel 2016, select Data > What If Analysis|Goal Seek.
Once we obtain the value for β, we can calculate the value of α by using the equation
![]()
Then we calculate the probability that the component will last more than 2,000 hours by using the WEIBULL.DIST function.
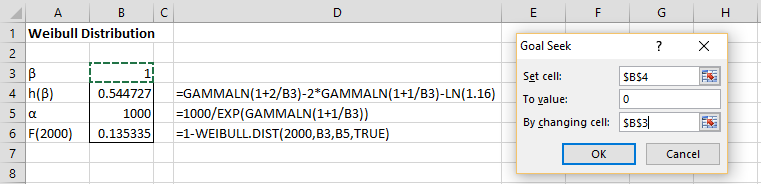
Figure 2 – Goal Seek initial guess
After clicking on the OK button, the result is shown in Figure 3.
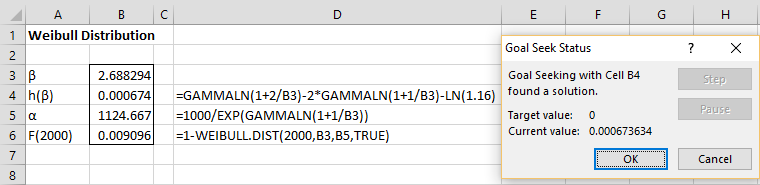
Figure 3 – Goal Seek results
The values for α and β are shown in cells B5 and B3. The probability that the component will last more than 2,000 hours is 0.91% as shown in cell B6.
Examples Workbook
Click here to download the Excel workbook with the examples described on this webpage.
References
Wikipedia (2012) Weibull distribution
https://en.wikipedia.org/wiki/Weibull_distribution
McCool, J. I. (2012) Using the Weibull distribution: reliability, modeling and inference. Wiley
https://onlinelibrary.wiley.com/doi/book/10.1002/9781118351994
Example 1: The time to failure of a very sensitive computer screen follows a Weibull distribution with α = 1,000 hours and β = .6. What is the probability that the screen will last more than 5,000 hours? What is the mean time to failure?
In this example, how to determine alpha = 1000 Hours ? my understanding is total hours divided by number of failures is this hours alpha ?
On a job, I want to find out if a equipment failed x time within 7 hours what is potential probability of that equipment lasting z hours ?
Hello Sanjay,
For Example 1, alpha was a known parameter. If instead, you knew the values of other metrics, you could estimate alpha. This is the case for Example 2 on this webpage.
If, for example, you had the history of data about similar computer screens, you could estimate the value of alpha (and beta) using the method of moments, the MLE approach or regression. These approaches are described at
https://www.real-statistics.com/distribution-fitting/
Regarding your last question, this depends on the details. E.g. what do you mean by “if the equipment failed x times with 7 hours”? If the equipment fails, should I assume that you have a very similar piece of equipment that replaces it instantaneously; otherwise, you would need to take the time to repair (or replace) into account? Suppose that the equipment fails 7 times in 7 hours and so I assume that the average time before failure (MTTF) is say 1 hour. I need additional information in order to calculate the alpha and beta values, from which I would be able to determine the probability that the equipment will last z hours. E.g. in Example 1, I also needed to know the standard deviation of the failures.
Charles
hi charles
can you give me a example that you get alpha and beta in Weibull distribution?
i dont know how to get tahat parameters.
thank you
Hi Mohammad,
See the following:
https://real-statistics.com/distribution-fitting/method-of-moments/method-of-moments-weibull/
https://real-statistics.com/distribution-fitting/distribution-fitting-via-maximum-likelihood/fitting-weibull-parameters-mle/
https://real-statistics.com/distribution-fitting/distribution-fitting-via-maximum-likelihood/fitting-weibull-parameters-mle-newtons-method/
https://real-statistics.com/distribution-fitting/fitting-weibull-regression/
Charles
thank you Charles
I have another question, in goal seek , why did you put the zero in target value?
Mohammad,
The formula shown above the sentence “The above equation takes the form h(β) = 0 …” is of the form formula = 0. This is the zero in the target value.
Charles
If alpha = 4 and beta = 1000 hours, what is the observed average failure rate if you don’t let any units age beyond x hours (e.g. 300, 1000, run till failure)
If I understand correctly you want to know the MTTF where you don’t let any units age beyond x hours. I presume that x is some value, say 1000. In this case, if a unit has not failed after 1000 hours, should it not be counted towards the average?
Charles
Dear Charles,
I need to calculate confidence intervals for shape and location parameters, betta and alpha for a life test statistics. I have the tables that I can fine Wl and Wu for lower and upper confidence bound on better and Zl and Zu for alpha. Is there an way of calculating them by excel when the number of samples and suspensions are given?
Tanya,
See https://www.real-statistics.com/distribution-fitting/distribution-fitting-confidence-intervals/
Charles
hey Charles
i am trying to do weibull model like the article (https://www.mdpi.com/1999-4907/11/2/144). i don`t know how data should be set to run the weibull distribution . i was wandering if you can help me.
thank you
Jamshid,
I don’t have enough time to read the article, although I did browse through it. If your goal is to fit some data to a Weibull distribution, then see the Weibull links on the following webpage:
https://www.real-statistics.com/distribution-fitting/
Charles
Hello Charles, i have another question. My treatment time is like (x)=0;2;4;6;8; and 10 minutes and my residual enzyme activity (y) =100; 68.00; 55.20; 45.3; 18.23 and 7.55 %. I found alpha and Beta to be 54.24334579 and 1.480699944 respectively. Now i want to calculate the mean time of failure. But the formula need Gamma function (г). How do i find the gamma function so that i can calculate the mean time of failure. Or i should calculate the mean time as the usual average of the
(x) and then calculate the gamma function. I m confused.
Elliot,
How did you map these (x,y) values to a Weibull distribution?
In any case, as you have seen the MTTF = alpha x Gamma(1+1/beta).
Gamma is a function that can be calculated in Excel by the GAMMA worksheet function. You should get a result of MTTF = 49.04683 for your problem.
Note that for a positive integer n, GAMMA(n) = (n-1)! = 1 x 2 x 3 … x (n-1).
Charles
hey charles,
it may not be the right place but i hope you could help me.
if the input data are times to repair, how can i calculate the estimation of repair rate as well as the other maintainability’s parameters ?
best regards
Mustapha
See the following webpage:
https://limblecmms.com/blog/mttr-mtbf-mttf-guide-to-failure-metrics/
I don’t know whether you can model MTTR using a Weibull distribution.
Charles
Dear Mr. Charles,
I have a question if I have a multi components for machine and have time to failure for each one , how can I calculate the weibull distribution for shape and scale for this components?
plz help me
Hello Fadia,
Are you saying that you have the mean time to failure for each of the subcomponents and each of these follows a Weibull distribution? Furthermore, is the failure of any one subcomponent independent of the failure of the other subcomponents?
Charles
Dear Mr. Charles
Thanks for replying,
I have time to failure for each of the subcomponents, and it’s independent of each other, I can’t calculate the MTTF because I don’t have the total no of failures for each component, but I have the total no of failures for the machine,
I need to find a Weibull distribution for those components?
Hello Fadia,
The following link may be helpful to you:
Using the Weibull Distribution: Reliability, Modeling, and Inference
By John I. McCool
https://books.google.it/books?id=ijHMGshc4-sC&pg=PA100&lpg=PA100&dq=mttf+two+components&source=bl&ots=s08nJTEmFc&sig=ACfU3U3Ns5GVEcMUqVmjoKcOLHtjrPLheQ&hl=en&sa=X&ved=2ahUKEwi379WitejpAhUFw8QBHSFhAhcQ6AEwEXoECAkQAQ
See section 4.1.1.
If for t=1; the distribution follows Weibull(alpha,beta) ; then on dt=1/252(lets say) what is the distribution? Is it Weibull(alpha*dt,beta), or Weibull(alpha,beta*dt) or Weibull(alpha*dt,beta*dt)?
What does t=1 refer to? What is dt?
Charles
Cool stuff. If someone supplies me data for a 24 hour time period (wind speed), and it includes average, standard deviation, and maximum, can I use this function to calculate the estimated hours for a given wind speed?
Bruce,
Do you believe this data follows a specific distribution? If so which?
Charles
Hi Charles,
I am trying to do a Monte Carlo simulation using the Weibull Inverse function to get the probability of wear out/corrosion rate is more than a certain value. I used the following:
=WEIBULL_INV(RAND(),Beta,alpha) and run it for 10 000 times and then CountIf(range, greaterthan VALUE)/10 000 … is this correct?
CR,
This looks like a reasonable approach.
Charles
Hi Charles,
Thanks for the reply. It works fine for me. Is there a way to get a confidence interval (e.g. 95%) for the calculated Beta and Alpha so I can change them in the Monte Carlo as well?
I plan to add this capability in the next release of Real Statistics. I expect this to be available this month.
Charles
Super!
Much appreciated Charles.
Hi Charles,
Please correct me if I am wrong: Your alpha and beta are the opposite to the MS Excel’s?
Yes, that is correct. Excel flips the usual definitions of alpha and beta.
Charles
Dear Mr Charles,
I have wind data for the year 2013, how can I calculate the shape and scale factors of the data or do I just estimate my own values?
Your hep will be appreciated.
Regards
Wilybard
See Distribution Fitting
Charles
Thank you so much.
Charles,
I would think that as long as we set the initial value of beta to be >0, the return values for alpha and beta would be the same when we use the Goal Seek capability. Is this correct understanding?
I chose 0.5 for the initial beta value and the returned final beta and alpha are not exactly the same as the ones in the text.
Thanks for your clarification in advance.
-Sun
Hello Sun,
I don’t know whether in general that choosing any positive beta value will return the same values, but it wouldn’t be surprising.
That you get slightly different alpha and beta values from what is shown on the webpage is also not surprising since the values obtained are only approximate and can vary depending on the Goal Seek settings. It is also quite likely that you will get more accurate results when using Solver instead of Goal Seek.
Charles
Thank you Charles for the clarification. The components I’m evaluating are rotary joints for a radar and I am getting a result I wasn’t expecting. I used the regression technique you demonstrated to determine Beta: β =SLOPE(ln(-ln(1-F(x))), ln(x)) and Alpha: α =EXP(-βln(α)/β). I would of expected a Beta value >1 yet, it ended up being .955. When I graphed the Survival Plot, it seems reasonable, meaning the more time the part is in service, the probability of that part surviving goes down. What has me turned around is when I calculated MRL I would expect the values to decrease but instead the opposite is happening which I assume is driven by Beta<1 value.
Thanks for the update, Fred. Glad I could help.
Charles
I have graphed a survival plot based on your paper on Survivability Weibull Distribution. There is a reference used in Survival time that I need clarification on:
60% of the Part 1 components are still functioning at time 825.31 (cell N13) as calculated by the formula =WEIBULL_INV(1-$M13,B$4,B$3). I don’t understand what B$4 and B$3 are or what paper they are referenced to.
Hello Fred,
Thanks for identifying this problem. I inadvertently omitted the first few rows of the spreadsheet in Figure 1 that contain the values 1120 for cell B3 and 2.2 for B4. These are the alpha and beta values for Part 1. I have now substituted these values in the formulas on the webpage so that things will be clearer for other readers. I appreciate your help in improving the website and I am sorry for any inconvenience the problem caused you.
Charles
Charles,
A new project has brought me back to your site, the land of many fond memories from not too long ago as I struggled through statistics and so forth. Your site has the effect of reminding me of how much I still don’t understand with the hope for the future.
However, I’m a bit lost on this project:
We have three different options for a added part to our system.
Option A: for an average system add 2 Model A widgets
Option B: for an average system add 12 Model B widgets
Option C: for an average system add 22 Model C widgets
Now all of these perform the same function just in different ways. Each seem to have slightly different expected failure rates but they appear to look like Weibull functions with infant mortality followed by a long uptick towards eventual 100% failure after around 12 years.
Now the challenge is to map out which Option to choose given the following:
1. Maintain 95% of production … so if there is 1 failure for Option A, we must repair immediately. For Option C we need to repair if three have failed.
2. Rolling a truck for repair is expensive.
3. At what point is it worth replacing everything given you have a tech on site and you’ve already had your threshold of failures. Assuming nothing lasts beyond 12 years, if you have one Option A failure at year 11 … you probably want to replace both while you are there.
My assumption is that this is a three parameter Weibull distribution but I’m not sure how to set up the modeling. Ideally, I’d have a general model where I could input the Option X parameters: number of widgets, production threshold, Weibull parameters.
Any thoughts on this matter? My other option is to just set up a simulation using Sigma or Arena or their ilk but I really think this could be a great little Excel widget using your add-on package.
Hi David and welcome back to the site.
Simulation may be necessary, but you may be able to use Excel’s Solver to perform the optimization. You will need to be able to quantify the optimization parameters such as costs for a repair (esp. for the truck). Currently, Real Statistics only supports the two parameter version of Weibull. I will add support for the three parameter version as a possible future enhancement.
Charles
Hi have a simple question how do you randomly create integers in excel between 1 and 10 that follow a weibull distribution? Is that possible?
Ed,
For any given values of alpha and beta, you can generate random values that follow a Weibull distribution with these parameters (i.e. alpha and beta) by using a Real Statistics formula of form WEIBULL_INV(RAND();…). You can simply ignore values that are not between 1 and 10. For some values of alpha and beta, few values will be ignored, but for others many (or perhaps even all) values will be ignored.
I don’t know of any way to guarantee that the values will be integers though.
Charles
i got standard deviation = 0,09 ; mean = 0,54 ; shape factor = 25,07 ; scale factor = 0,55 m/s and then i tried to compute in dist.weibull excel PDF =1,806E-09. so how to compute the probability P(x) ?
NB : im using x = 0,2
Oky,
The pdf should be calculated by =WEIBULL.DIST(0.2,25.07,.55,FALSE), yielding the value 1.21354E-09. The probability P(x) of less than x can be calculated by the formula =WEIBULL.DIST(0.2,25.07,.55,TRUE), which yields the value 9.6812E-12.
Note that there is a relationship between the mean/stdev and shape/scale, but I did not check to make sure that the values for mean/stdev are consistent with the shape/scale parameters.
Charles
Thank you for an interesting and thorough article. I do have several questions, though:
1) I have several failures that in my data are listed as occurring in the same hour. Because of that, the time between failures is 0 and ln(t) is (- INF). Any suggestions on dealing with that?
2) Can Weibull be legimately used on both small components (a bearing or a solenoid valve) as well as on an entire assembly (a filler or a packing machine) that is made up of many of the smaller components? Can it be scaled for “any failure” as well as for a specific failure of a component?
3) Is it legitimate to call t the time from the last failure or should t be measured from some constant t(0)? In other words, if a machine runs for 100 hours, then breaks, then runs for another 50 hours and breaks again, are the data points 100 and 50 or 100 and 150?
Thank you very much for your assistance.
Bob,
1) The data either follows a Weibull distribution or not, or at lease is close enough to a Weibull distribution that it can be modelled by one (and so accurate results can be generated based on this estimate). Depending on what you are trying to use the Weibull distribution for the fact that you have multiple failures in the same hour may not be important or it may be very important. If necessary you may need to use finer granularity, e.g. minutes instead of hours. On this particular webpage, we are concerned with the mean time between failures, and so there can be multiple failures in the same hour. What are you trying to accomplish?
2) I don’t seeany reason why you couldn’t model components as well as assemblies. The model can be used for any and all failures, but remember it will be an estimate only, and so again, your question “Can it be scaled for “any failure” as well as for a specific failure of a component?” depends on what you plan on doing with the Weibull distribution.
3) The Weibull distribution is not memoryless and so previous failures impact future failures. You can’t restart the clock from zero after a failure.
Charles
FYI: Excel’s definitions of alpha and beta seem to be reversed. Excel shows the format as WEIBULL.DIST(x, alpha, beta, cum) not WEIBULL.DIST(x, beta, alpha, cum).
Richard,
Yes, but the Excel seems to reverse the roles of alpha and beta, which is why I corrected this on the website.
Charles
Thanks for the post man, and the additional comment on the roles of alpha and beta.
I was trying to understand why Excel was giving wrong results, its because a and b are mixed up, now I got it right..
Ahmet,
Yes, Excel got alpha and beta mixed up.
Charles
Charles,
Thank you very much for putting such a powerful tool together. I’d like to use your tools to generate populations with specific distributions, but one of the sets of data that I have are best fit with a Smallest Extreme Value distribution. Based on my understanding of the relationship between SEV and Weibull, I took my distribution {Y} and transformed it by taking 10^{Y} . Then I determined the Weibull distribution parameters for the transformed data. These parameters I used with your WEIBULL_INV function to build a population (“WEIBULL_INV(RAND(), shape, scale)”) in Excel. Then I took the log of each value to obtain a population with an SEV distribution. Is that a proper use of the relationship between SEV and Weibull, or is there a more correct method?
Thanks again for the work you put into this web site and the tools.
Daniel,
I believe that the approach you are using makes sense, but I give you two cautions:
1. The log is base e and not 10, and so you need to use EXP(Y) instead of 10^Y.
2. There are at least 3 types of SEV distributions. You are modelling one of these.
Charles
Thanks for the feedback, Charles, especially the correction of the base of the logarithm. (Really wish there was consensuses on what base is meant when “log(x)” is written.)
Dear sir,
I have mean and the variance value of Weibull distribution then how to i find the values of alpha, beta and Gamma
Sivajothi,
The website presently only deals with the two parameter version of Weibull. How to fit the parameters to the data is explained on the following webpage.
https://real-statistics.com/distribution-fitting/
If you only have the mean and variance, then you will only be able to use the method of moments.
Charles
How to assume/find value of alpha and beta ?? in above examples their values are given .But how find them??
See
Distribution Fitting
Charles
Hi Charles,
Many thanks for your great website. Perhaps a silly question, but how could I produce a 3-parameter Weibull distribution with a location parameter different from zero?
Many thanks.
Wayne
Wayne,
If theta is the location parameter, then WEIBULL.DIST(x – theta, beta, alpha, cum) will calculate the three parameter Weibull distribution.
Charles
Hello Charles,
i have plotted a weibull for the failure received and want to see the predicted trend. i have calculated the weibull parameter as suggested at https://www.qualitydigest.com/magazine/1999/jan/article/using-microsoft-excel-weibull-analysis.html#
and now i have some question which i am not able to find anywhere. i can sample excel if this helps.
1) As we have processed the data to be represented by linear equation by taking natural logs and got the parameter for this linear equation. Does the slope need to calculated for its confidence interval.
2) We calculated weibull plot CDF and 1-CDF is plotted on chart as reliability. How to plot the confidence interval and prediction interval.
3) i also tried plotting confidence interval and prediction interval for linear equation using t critical value but these are very narrow and just follow the trend-line. i have doubt that i am doing it correct?
Jain,
I believe that the article is describing the procedure that I have described on the following webpage:
https://real-statistics.com/distribution-fitting/fitting-weibull-regression/
Regarding your questions:
1. You don’t need to calculate a confidence interval for the slope, but you can do so. This is described on the referenced article and is the usual confidence interval for linear regression, but with a reverse transformation, undoing the ln(x) by taking exp(x).
2. To plot the confidence or prediction intervals for linear regression involves creating a two additional scatter plots, one for the upper limits and one for the lower limits. Thus you have three scatter plots on the same chart: one for the data, one for the upper limits and one for the lower limits. You can create a table with four rows: (1) x data, (2) y data, (3) upper limit for predicted y, (4) lower limit for predicted y; the plots are x data vs. each of the three types of y values. I don’t know whether this is the same thing as the CDF and 1-CDF charts that you are referring to.
3. The scatter plots described in item #2 should look something like that shown in Figure 1 on the following webpage
https://real-statistics.com/regression/confidence-and-prediction-intervals/
Charles
Thanks for the response.
For linear regression i could plot the confidence bounds. Thanks however as asked in earlier question ” We have calculated weibull plot CDF and 1-CDF is plotted on chart as reliability. How to plot the confidence interval and prediction interval.” i do not find a clear article on this point as not the data is processed to plot the weibull. is there any sample workbook on internet using excel?
2) Another doubt is that the article i have used is using Benard’s approximation as =(X-0.3)/(N+.4) while in your article it is =(X-0.5)/N. Which one is more accurate and why ?
I need your help to do Weibull analysis in our product
Karthi,
What sort of help do you need?
Charles
what kind of help you need? Please share
Kuldeep,
Based on all the questions I have been receiving lately about the Weibull distribution I plan to add more details to the website and Real Statistics software in the next release. For now, let me address your questions:
1. You can create a range with three rows: one for the predicted values, one for the lower end of the confidence interval and one for the upper end of the confidence interval. You then highlight this range and use Excel’s Line chart capability
2. I don’t see any reference to (X-.5)/N on this webpage. Where are you looking at? Bernard’s approximation is commonly used and I will address this issue in the next release.
Charles
Charles
Thanks,
You have used (X-.5)/N as “=(A4-0.5)/A$15 in cell E4” on https://real-statistics.com/distribution-fitting/fitting-weibull-regression/
i will try the plot the line as suggested and will revert if needed. thanks
Kuldeep,
Thanks for the clarification. I am in the process of using the Benard’s approximation and also implementing Weibull distribution fitting even when there is censored data. I will try to also provide an example of how to graph the prediction intervals as well. These capabilities will be added when I issue the next software release.
Charles
Hi Charles, How are you?
Charles, I utilized 3 different methods to model the Weibull (two from your site) and they give me relatively similar information MTTF of 20072, 21062, 23400 hours(MLE, MOM, MedRR with R2=0.92) with different parameters. All Betas >1
My question, I want to determine which one has the smallest MSE or RMSE with respect to my data. How do you get the predicted Ys so I can compare with the data (or in this case X=hours)?
Hi Miguel,
To get the “predicted” y values just use the WEIBULL.DIST function with the estimated alpha and beta values.
Charles
Charles, thanks for the response. I used the Weibull with the data and estimated parameters to generate the Cum Prob, then I used the Weibull_Inv and generated the predictive Y’s.
Charles, I have a couple of questions related to what to do after modeling the Weibull for equipment failure.
From a population of 352 machines, 62 of them failed this year (~18%) and by modeling the Weibull distribution on the 64 failed machines, I estimated the MTTF around 16850 hours. If I understood correctly, after viewing a histogram, this tells me that 50% of the machines failed by the time the machines reached 16850 hours of operations. Some of these machines failed around 10600, 14700, 15835, 16083,…,, 18907 hours. Of the 62 that failed, 31 reached or passed the MTTF.
Of the 352 machine, 80 reached or passed the estimated MTTF (~23%), 31 failed (~39%) and 49 others did not failed after passing the MTTF.
If I want to estimate budget for next year maintenance/repair, I would estimate the hours of operations of all machines to determine which ones will reach or pass the MTTF. Assuming 11 will reach the MTTF + the 49 that already reached the MTTF, therefore 60 machines will reach the MTTF.
So, for what % of machines I budget?
– For the 18% of the population (proportion that failed last year)?
– For the 39% of the 60 that will reach the MTTF+ 9% of the total population (50%of the machines that failed before MTTF last year)?
– Any suggestions?
Thanks,
Miguel,
1. MTTF means mean time to failure. If MTTF = 16850, this doesn’t mean that half the machines will fail in less than this time and half will fail after. That would be the median time to failure.
2. Since there are 8760 hours in a year, after one year, you should expect that not all 352 machine would fail in the first year. If the shape parameter < 1, then you would expect that the failure rate would decrease over time and so you would have fewer failures next year than this year. The reverse is true if the shape parameter > 1.
3. Regarding how many repairs you should budget for next year, first you need to decide whether you budget for the average number of failures in year 2 or allow for some cushion in case this number is higher than the average. You can also decide that you will budget for the median number of failures in year 2.
4. You also need to decide what happens with machines that fail in the first year. Do they get taken out of service or get repaired. If they get repaired does their MTTF change?
5. Let’s give an example. Suppose alpha = 1,000 hours and beta = .6 (as in Example 1 on the referenced webpage). Then MTTF = 1504.575. Now suppose you have 1000 screens assume that when a screen fails it is simply taken out of service. Now let’s estimate the number of failures in month 2, assuming each month has 30 days (or 720 hours). There are The probability that a screen will last through month 1 is =1-WEIBULL(720,.6,1000,TRUE), which is .44. Thus of the 1000 screens we expect that 440 will still be running after one month. The probability that a screen will last through month 2 is =1-WEIBULL(1440,.6,1000,TRUE), which is .288. Thus, we expect that 288 of the 440 screens that were running after one month are still running after two months, and so on average 440-288 = 152 fail during the second month.
Charles
Hi Charles, first thanks your answers!
Charles, I have another question :
I have data for 18 compressors with 8 cylinders per compressor. A total of 144 Cylinders/Pistons. During the last year they were overhauled and in accordance to the manufacturer their average life is 10000 hrs.
18 of the cylinders failed with hours between 2200 to 13250. I model the Weibull (With 3 methods as you instructed us in your site/ MRR/MLE/MOM). All of them provide similar parameters. Using MLE, B=2.32, Alpha=7492, MTTF=6638.
Now, since B>1, it means the failure rate is increasing (Wear-out phase) even though they were overhauled during last year, do I suppose to use the Beta/Alpha from the Weibull estimated or I suppose to ignore that and use B=1 or less and assume they are at the increasing or constant failure rate? I asked because when comparing other colleagues using Minitab, their Reliability curve and MTTF are much larger.
Thanks again for sharing your knowledge!
Miguel,
Please explain what the justification is for ignoring the beta values of 2.32 and using a beta values less than or equal to one.
Charles
Can anyone answer this?
The life of an X-ray machine in hours follows the Weibull distribution, with β = 3 and η=1000 hours.
Determine:
a) The mean and standard deviation of the life of the machine
b) The probability that the X-ray will fail before 250 hours.
Roger,
How to solve these problems is described on the referenced webpage.
Charles
Roger, did you find a solution to your question? I would like to have a solution for it as well.
This is only working for me if I swap alpha and beta between WEIBULL.FIT (or FITM or FITR) and WEIBULL.DIST. It appears that WEIBULL.FIT calls beta the shape parameter, but WEIBULL.DIST considers alpha the shape parameter.
Hi,
I have some measurement data depends on shoot.I want to identify an upper limit for data and estimate to shoot for upper limit.
Data don’t increase/decrease depends on time.
Have you any suggestions?
Sorry, but I don’t understand your question.
Charles
Pedro,
My response is probably displays my ignorance, but… If I understand how Excel is handling the pdf calculation, it needs to give a value to the width at the points in question, since otherwise the pdf evaluates to 0 at any point, so Excel assigns a value of 1. You are breaking the integers into 1/2 but the area at each point continues to be assumed to have a width of 1. So, if you divide by 2 your answers will work out. If you breakup the range into 10ths then divide the results by 10 and so on.
WEIBULL.DIST(x, β, α, TRUE) is only working with x=integer. Does anyone know a way to include numbers with fractional component? Regards, Pedro
Pedro,
That is strange. When I use WEIBULL on my computer it handles non-integer values of x.
Charles
Hi Charles, thanks for your response.
More precisely, I am building a weibull distribution (no cumulative) with the WEIBULL.DIST(x; 3; 9.46; FALSE). First I let x goes from 1 to 25 (only integers) and so my distribution looks good when I sum each one of the outputs of the above function (sum = approx 100%). The problem is now that I need to plug franctions into the x variables. For instance, now I need to build the same distribution with an unit variation of 0,5 so that inserting 1, then 1.5, then 2, then 2.5, then 3, then 3.5…until 25,5. The sum of this distribution is now a number close to 200% and so an incorrect result. Is there anyway to overcome this situation? I tried to avoid the excel function applying the direct formula but the result remains incorrect. For instance; (beta/(alpha/0,89))*((x/(alpha/0,89))^(beta-1))*(EXP(-((x/(alpha/0,89))^beta))). I really appreciate your valuable thought on that.
Best regards,
Pedro (congratulation for this website I have gone through a very fruitful readings)
Pedro,
If you have a discrete distribution, then you can sum pdf values as you have described. You can’t do this with a continuous distribution such as the Weibull distribution. Why do you want to do this sort of summing anyway?
Glad you like the website.
Charles
Hi Charles,
Understood. The weibull pdf is for the wind distribution and I was trying to insert x with 0.5 unit because that’s the way that the turbine supplier is giving to me the power coefficient curve (so weibull distribution times 8760 hours in a year times the power curve will result in the annual energy production). I can do the job with the intergers only but the result should not be the same. While I am writing I am considering running a monte carlo like =(α*(-LN(1-Rand()))^(1/β))+min. I have to figure out the best way to do format that but this is a possibility. Do you have any advice?
Best regards,
Pedro
Pedro,
Since I don’t understand the situation well enough, I am not able to comment further.
Charles
Hi Charles, the article was very informative. I’m, working on a project to revise the maintenance schedule for a machine. I believe the time between failures follows a Weibull distribution as the chance of failure increases with increase in time after each maintenance. The average time of failure with the current maintenance schedule (every 700 hours) is 500 hours. So, am suggesting a revision of the current schedule to do a maintenance at every 500 hours. I calculated the parameters for the Weibull distribution. What I’m stuck now is at how I can quantify my results financially. In other words, for the new maintenance schedule, I have to show that the average time of failure if higher than what it is for the current schedule. Any insights on how I should go about this?
Deepika,
This sounds like a financial break-even analysis (and not a statistical analysis). You need to calculate the cost for each scheduled maintenance and then calculate the total cost over a sufficiently long period of time (this could be one year) based on whatever MTTF values you want to study. You then need to estimate the cost of one failure (in terms of repair costs, lost productivity, impact of the rest of the operation, etc.) and then based on the average number of failures per year (for each MTTF estimate) the total costs for failure.
Charles
Very nice and elegant. I compared your result of the Weibull parameter estimate from Mean and stdDev to the Weibull estimate function of .Net lib MathNet.Numerics.Distributions (also called Math.Net Numerics). Yours give a better estimate. I can’t paste pictures here, but if you drop me an email, I’ll email them to you.
Rgds, Reinoud
Reinoud,
Good to hear. You can find my email address at Contact Us.
Charles
I have monthly demand data for a certain product, it is following Weibull distribution (2 parameter,I calculated the 2 parameters). Now I want to know the 5 month distribution of demand based on the above information.
Does 5 month demand distribution also follows weibull, how to know that ?
Sorry, but I don’t know the answer to your question. Perhaps someone else can help. Also, perhaps the following paper can help>
https://www.jstor.org/stable/3009409?seq=1#page_scan_tab_contents
Charles
tq charles for reply my email..
during my reading, i have got some idea that to find the parameter of weibull distribution, we can find it by several methods such as maximum likelihood estimation MLE, modified maximum likelihood estimation (MMLE), energy patterm method (EPF) and etc…
my question is, how we can use that several methods in excel to find the parameter
Daniel,
Sorry, but I have not implemented these techniques for the Weibull distribution. With as little work you could use Excel’s Solver to implement this. I have shown how to do this sort of thing a number of times on the website.
Charles
tq mr charles…do you have any suggestion how to use the method..
Daniel,
Is this a follow up on my reply from June 2016? If so, which method are you referring to? MLE?
Charles
hello…
how we can calculate the parameter for weibull distributions. can someone help me
Daniel,
You can use the approach shown in Example 2 of the referenced webpage.
Charles
A widget has Weibull distribution with shape 2.0 and scale 700. There are three identical widgets in parallel in my system such that a minimum of one is required. Given that all widgets have survived 200 hours so far, need the probability that one of the three widgets fails in the next 3 hours, another of the remaining two widgets fails within 15 minutes of the preceding widget failure, and the third widget survives the entire 3 hours and 15 minutes? Thanks
Sorry George,
This sounds like a homework assignment, and I have a rule that I won’t answer such questions.
Charles
Not a homework assignment. Its a real problem and a proposed solution is Prob(one failure in next 3 hours given survived 200 hours) * Prob(one failure in next 3 hours and 15 minutes given survived 200 hours) * Prob(no failure in next 3 hours and 15 minutes given survived 200 hours) * a multinomial coefficient of 6. The result seems unattractive compared to no failures at all which is modeled as (Prob(no failure in next 3 hours and 15 minutes given survived 200 hours))^3. I believe that the two failures should be calculated as the probability of two failures within 15 minutes of each other given both survived 200 hours, but do not know how to model such, or how to then incorporate the non failure.
George,
Let’s try to tackle the first of these problems, namely that “Given that all widgets have survived 200 hours so far, need the probability that one of the three widgets fails in the next 3 hours”.
We begin by tackling the simpler problem that “Given widget 1 has survived 200 hours so far, what is the probability that it fails in the next 3 hours?” Let A = widget 1 has survived 200 hours so far and B = widget 1 fails in the next 3 hours. You want P(B|A), which by Bayes’ theorem is equal to P(A and B) / P(A). Now P(A) = 1-WEIBULL(200,2.700,TRUE) = 1-.07839 = .92161. You can use WEIBULL.DIST instead of WEIBULL for versions of Excel after 2007. P(A and B) = WEIBULL(203,2.700,TRUE)-WEIBULL(200,2.700,TRUE) = .08066 – .07839 = .00227. Thus, P(B|A) = .00227/.92161 = .002464. This also means that given widget 1 has survived 200 hours so far, the probability that it does not fail in the next 3 hours is 1 – .002464 = .997536.
Assuming that the survivability of all the widgets are independent of each other, then the same calculation holds for widgets 2 and 3 as well. Since we want exactly one widget to fail and the other two to not fail, there are C(3,1) = 3 ways to choose the failing widget and so given that all widgets have survived 200 hours so far, the probability that exactly one of the three widgets fails in the next 3 hours = 3 * .002464 * .997536^2 = .007356.
Assuming I haven’t made a mistake in logic or arithmetic, this should take care of the first problem. I’ll let you handle the others.
Charles
Thanks
Is it possible to create a formula of the shape (a) and scale (B) parameters for a Weibull distribution to have a fixed mean but allow the user to change the variance?
For example Weibull(a,B) where EX=Fixed Number and VarX=d where d is all real numbers
I understand that the shape and scale parameters will change every time.
James,
I don’t understand your question. Once you specify the shape and scale parameters the mean and variance are determine (as described on the referenced webpage). If you specify only the mean and variance you can calculate the shape and scale parameters as shown in Example 2; in this case the function would Weibull1(mean, var).
Charles
Thank You. I finally figured it out. Your example was very helpful!
Hello Dr. Charles,
Happy Easter
For this problem:
Given a Weibully distributed population with a shape parameter of 4.66 and a scale parameter of 52. 12.6% is the probability of being greater than what value?
The answer should be 60.79592
Using WEIBULL(12.6, 4.66, 52, TRUE) I get 0.00135
I am not sure how to get the correct amswer
Thanks
Gami
Gami,
I think you are asking me, what is the value of x such that WEIBULL(x, 4.66, 52, TRUE) = 1 – .126.
You can try to find the value of 60.79592 by trial and error, guessing at the correct value of x.
You can also use the Real Statistics formula =WEIBULL_INV(1-.126,52,4.66).
Charles
Perfect!!
The WEIBULL_INV worked like a charm
Thanks again
Gami
Hello Charles:
How can I solve the following problems in Excel using the “WEIBULL.DIST” function?
1) Given a Weibully distributed population with a shape parameter of 3.93 and a scale parameter of 151. 34.2% is the probability of being greater than what value?
2)What is the probability that a randomly selected item from a population having a Weibull distribution with a shape parameter of 3 and a scale parameter of 109.3 has a value between 85.6 and 97.5?
Thank you
Gami Nasir
Gami,
1) WEIBULL(x, β, α, TRUE) = the probability that the distribution has a values less than or equal to x, where alpha is the scale parameter and beta is the shape parameter.
2) The probability that the distribution has a value between x1 and x2 is WEIBULL(x2, β, α, TRUE) – WEIBULL(x1, β, α, TRUE).
Charles
Thank you very much Sir!
Hello Dr. Charles,
For this problem:
Given a Weibully distributed population with a shape parameter of 4.66 and a scale parameter of 52. 12.6% is the probability of being greater than what value?
The answer should be 60.79592
Using WEIBULL(12.6, 4.66, 52, TRUE) I get 0.00135
I am not sure how to get the correct amswer
Thanks
Gami
Charles,
One more question: In the final example 2 equation, after you substitute for alpha, how are you simplifying ln(1,160,000)-2*ln(1,000) into ln(1.6)? I get ln(1,160,000)-2*ln(1,000) = .14842, but ln(1.6) = .470004.
I apologize in advance if I’ve made some simple arithmetic error, or if I’m forgetting some natural log rule… 🙂
Thanks,
Zach
Hi Zach,
You are correct. It looks like I made a typing error. ln(1,160,000)-2*ln(1,000) should be ln(1.16), calculated as follows.
In general, ln(x)-2ln(y) = ln(x)-ln(y^2) = ln(x/y^2). Thus, ln(1,160,000)-2*ln(1,000) = ln(1,160,000/1,000^2) = ln(1,160,000/1,000,000) = ln(1.16).
Thanks for catching this. I will correct the referenced webpage shortly.
Charles
Glad I could help! Thanks for the explanation and quick response.
Zach,
Your help is very appreciated. I have just corrected the referenced webpage. I hope I got it correct this time.
Charles
Charles, I’m confused about how you calculated the excel values in Figures 2 and 3. For the F(2000) calculation using the excel WEIBULL.DIST function, which takes WEIBULL.DIST(x, Alpha, Beta, Cumulative), you seem to have selected your Beta value (B3) for Alpha, and your Alpha value (B5) for Beta. Is something wrong there, or did you intentionally swap the two values?
Any clarification would be very appreciated!
-Zach
Zach,
Excel swapped the usual definitions of alpha and beta. I just flipped then back. In any case, either way, you should have WEIBULL.DIST(x, scale, shape, cum).
Charles
ahhh, I see what you mean. Good old Microsoft…
Thank you for the explanation! Your website is very helpful. 🙂
Cheers,
-Zach
Sir
In variance equation (example 2) why you use 12/beta, instead of 2/beta, as it is told at “key statistical properties of the Weibull distribution” section?
Thanks alot
Nugroho
Nugroho,
Thanks for catching this error. The value in the example should be 2/beta. In fact, there are a couple of errors in this example, which hopefully I have now corrected.
Thanks for your help in making the website more accurate.
Charles
Hi Charles ,
You wrote an interesting subject.
I am trying to find the excel formula for variance of the Weibull distribution given you have the alpha, beta, and mean. Can you share with us ?
Thanks.
The formula for the variance from the alpha, beta, and mean µ can be found on the referenced webpage.
Charles
Hello,
I would like to run a Weibull analysis to determine how many cycles to run a selected sample set to. For example, if I have a hydraulic cylinder that is designed for 2000 cycles, how many cycles do I have to run a sample set of ‘X’ to have a confidence level of ‘Y’ with a β of ‘Z’? How would the Weibull equation be set up to perform this function. Thanks in advance.
Ron,
Before answering your question, let me make sure that I understand your question properly.
1. I have a hydraulic cylinder that is designed for 2000 cycles.
[CZ] I assume that you mean that the MTTF = 2000. Is this correct?
2. How many cycles do I have to run a sample set of ‘X’ to have a confidence level of ‘Y’ with a β of ‘Z’?
[CZ] I understand that Y takes a value such as 95%, meaning that you want a 95% confidence interval. I assume that Z takes a value such as .6. Is this correct? I don’t understand what sort of values X takes; can you explain this better?
Charles
Very good explanation, it helped me a lot! Thanks!
Hi,
I’m trying to analyze data in Table 4 of this report on electronic waste (e-waste) in the U.S.:
U.S. EPA, 2011
I’m trying to determine what Weibull scaling factor and shape factor would best describe the data in Table 4. For example, for portable computers, we have:
20% are discarded in 4 years
35% are discarded in 5 years
55% are discarded in 6 years, and
100% are discarded in 7 years.
What scaling factor and shape factor would come closest to those values? Just by trial and error and eyeballing, I came up with a shape factor of 4.1 and a scale factor of 5.8. With those values, I get cumulative discards in years 4 through 7 of:
Year 4 = 20% (versus 20%)
Year 5 = 42% (versus 35%)
Year 6 = 68% (versus 55%), and
Year 7 = 88% (versus 100%).
But I’d like to do something that’s quicker than trial and error, and hopefully matches Table 4 a little better. (Though I realize Table 4 may contain data that simply don’t follow a realistic Weibull distribution.)
Thanks!
Mark
You can calculate the mean and standard deviation of the data that you have and then use the approach described in Example 2 of the referenced webpage to estimate the values of the shape and scaling factors.
Charles
Hi, Sir.
How can I compute the values of shape and scale parameters given that I have the values of mean and standard deviation?
Lara,
I have just added Example 2 to the referenced webpage. This example shows how to calculate the shape and scale parameters from the mean and standard deviation.
Charles
Hi,
Thanks for the above information.
I have a problem , in which I need to use the Weibull distribution to generate a few data points to simulate a systems. This basically means, given the MTTF, alpha and beta, I need to come up with various time instances at which the system faults occur and use these time instances to simulate the response of the system.
Could you please suggest a way to get these time “fault time instances” such that it follows a Weibull distribution with given parameters.
Any help is appreciated. Thanks in advance. 🙂
Siva,
To generate a random data element which follows a Weibull distribution with fixed alpha and beta values you can use the Real Statistics formula
=WEIBULL_INV(RAND(),alpha,beta)
Alternatively, you can use the Excel formula
=alpha*(-LN(1-RAND()))^(1/beta)
Finally note that MTTF = alpha*Gamma(1+1/beta), and so if you have any two of the values alpha, beta and MTTF the third is determined. Thus, if you are given all three you need to make sure that the three values are compatible.
Charles
thank you sir,
please would you like to give me how can i calculate alpha and beta from standard deviation and average using excel (target value).
Lisa
Lisa,
The referenced webpage shows how to calculate the mean and variance (and therefore standard deviation) from the alpha and beta parameters. Theoretically you should be able to solve for alpha and beta if you know the values of the mean and standard deviation (two equations in two unknowns). Given that the equations involve the gamma function this may not be so easy to do analytically. You should be able to come up with approximate solutions by using Solver, however.
I don’t know what you mean by “target value”, however.
Charles
I think that, in example 1 the value of Alpha is being Substituted with Beta , and this is really confusing for me , Could you honored confirm my assertion.
Thanks alot
Hassan Elsafty
Hassan,
I just checked and it seems that everything is correct in Example 1.
Charles
Something is still off. “Beta = 1000 hours”. According to the tutorial above, “beta” should be unit-less. “alpha” should have units of time (1/alpha is mean failure rate). Your use of “beta” and “alpha” in the tutorial is opposite to the use of “beta” and “alpha” in the Excel function.
Evan,
Thank you for identifying this problem. Excel interchanges the roles of alpha and beta from what is used in other sources. Beta is commonly used as the shape (or slope) parameter and alpha as the scale parameter, although other symbols are used by various authors. I have now corrected the referenced webpage to be consistent with this choice of symbols, and so the Excel Weibull function becomes WEIBULL(x, beta, alpha, cum).
Charles
I need more application by using weibull distribution on health related area.
I’ll try to add an application of Weibull to healthcare area in the future.
Charles