Basic Concepts
Another approach to finding the parameters for a Weibull distribution is based on linear regression. First, note that the cumulative distribution function of a Weibull distribution can be expressed as
![]()
and so![]()
Taking the natural log of both sides of the equation yields the equation
![]()
Multiplying both sides of the equation by -1 and then taking the log again yields the equation
![]()
This can be expressed as the linear equation
![]()
where y = ln(–ln(1–F(x))), x′ = ln x and a = –β ln α. Thus if the sample has a Weibull distribution, then we should be able to find the coefficients via linear regression. We now show how to do this in Excel using the SLOPE and INTERCEPT functions.
Examples
Example 1: Repeat Example 1 of Method of Moments: Weibull Distribution using the regression approach described above. The data is repeated in range B4:B15 of Figure 1.

Figure 1 – Fitting a Weibull distribution via regression
First, we sort the data (e.g. by using the Real Statistics array formula =QSORT(B4:B15)) in column C. Now the x values in the regression are the values of LN(x), i.e. the values in column D. To get the y values, first, we calculate the estimated values of F(x) by placing the formula =(A4-0.5)/A$15 in cell E4, highlighting the range E4:E15 and pressing Ctrl-D. This is similar to the approach used to create a QQ Plot as described in Graphical Tests for Normality. Alternatively, we could use Benard’s approximation by inserting the formula =(A4-0.3)/(A$15+.4) in cell E4.
Next, we enter the formula =LN(-LN(1-E4)) in cell F5, highlight range F5:F15 and press Crtl-D. The y values for our regression are those found in column F.
We now estimate β parameter to be 3.746 using the slope of the regression line (cell I3 of Figure 2) and α to be 692.088 using the intercept of the regression line (cells I4 and I5 of Figure 2).
From the scatter chart shown on the right side of Figure 2, we see that the Weibull distribution is a good fit for the data (i.e. the linear trendline aligns pretty well with the data elements).
We also see that the R-square value is quite high (cell I13) and the sample mean and variance are quite close to the theoretical values determined by alpha and beta (range I7:I8 and I10:I11).

Figure 2 – Using regression to calculate the Weibull parameters
Worksheet Functions
Real Statistics Function: The Real Statistics Resource Pack contains the following array functions that estimate the Weibull distribution parameter values which fit the data in range R1 based on regression. R1 is a column array with no missing data values.
WEIBULL_FITR(R1, lab, benard) = returns an array with the Weibull distribution parameter values and the R-square value. If lab = TRUE, then an extra column of labels is appended to the output (default FALSE). If benard = TRUE (default) then Benard’s approximation is used; otherwise, the version described above is used. MLE is the LL value corresponding to the alpha and beta parameters.
For Example 1, Figure 3 shows the output from the array worksheet formula =WEIBULL_FITR(B4:B15,TRUE,FALSE), while Figure 4 shows the output from the array formula =WEIBULL_FITR(B4:B15,TRUE) (the version with Benard’s approximation).
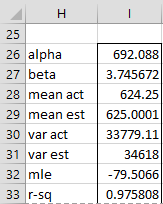
Figure 3 – Output from WEIBULL_FITR without Benard approximation

Figure 4 – Output from WEIBULL_FITR with Benard approximation
Examples Workbook
Click here to download the Excel workbook with the examples described on this webpage.
References
Evans, J, W., Kretschmann, D. E., Green, D. W. (2019) Procedures for estimation of Weibull parameters
https://www.fpl.fs.usda.gov/documnts/fplgtr/fpl_gtr264.pdf
Dorner, W. W. (1999) Using Microsoft Excel for Weibull analysis
https://www.qualitydigest.com/jan99/html/body_body_excel.html
ReliaWiki (2019) The Weibull distribution
https://www.reliawiki.com/index.php/The_Weibull_Distribution
NCSS (2017) Distribution (Weibull) fitting
https://www.ncss.com/wp-content/themes/ncss/pdf/Procedures/NCSS/Distribution-Weibull-Fitting.pdf
Hi Charles, great write up, learned a lot, and I will note your website in my write up and refer my students to your web. Quick question, trying to plug your alpha and beta into the WEIBULL.DIST function in Excel. Excel has alpha as the 2nd argument and beta as the 3rd. If I put alpha where alpha is stated and so forth, the function blows up. Reverse positions, beta to alpha and alpha to beta and it works fine. Am I missing something or is Excel using the wrong argument names?
David,
I believe that Excel mixed up the arguments.
Charles
Hello Charles,
What if x takes negative values?
Hello Stefan,
For the Weibull distribution x can’t take negative values.
Charles
Charles,
Thank you very much for your informative article.
Previously, I have used Excel to produce a histogram, then used a least squares method with solver to fit a Weibull distribution, using an additional column.
What I don’t understand from your method, is why F(x) is the rank of the data point divided by n, i.e. the canonical position in the list (from 0 to 1). F(x) from the original formulae is the Weibull distribution itself. I’m missing something fundamental here…
Paul
Hi Paul,
This is a commonly used approach for estimating the cumulative distribution function F(x). This is also used by the Kolmogorov-Smirnov test and the Anderson-Darling test.
Charles
Charles,
Please could you include examples with multiple examples of censored data. I don’t think the method of moments works with censored data but ranked regression and MLE do, If we are trying to calculate reliability with components that have scheduled replacements (that have variance in the ages they are changed) and taking into account the age of the components currently fitted, (all censored data) as well as the ages when the components fail, we should get better results
See
https://www.real-statistics.com/distribution-fitting/distribution-fitting-via-maximum-likelihood/weibull-censored-data/
https://www.real-statistics.com/distribution-fitting/distribution-fitting-via-maximum-likelihood/weibull-with-multi-censored-data/
Charles
Hi Charles,
I had a bit of a question about fitting probability density functions (specifically the Weibull Distribution) to a set of data, although it is in a different case to the one you discussed, I was still hoping you could help me. I have seen a number of examples where the distribution is directly overlaid on the histogram and they both share the same axis titles and I don’t fully understand why this is, specifically with the y-axis.
From my understanding, the y-value for the distribution is the probability density, which can be described as the rate that the probability is changing over the unit that x is (or the probability per x). The y-axis for the histogram is simply the number of times that a specific outcome has occurred, so I am not entirely sure how these two can be equated. Should the axis titles be different? I’m not entirely sure why the standard layout seems to be sharing the same axis title?
Elisabeth,
If you had a very large sample and your histogram had lots of bars then the histogram would match the distribution graph quite well. Of course, the units on the y axis would be different. For the histogram, the units are frequency numbers. You can think of the perfect histogram as slicing the area under the distribution curve and the x-axis into lots of rectangular bars. In fact, as the width of these bars approaches zero the histogram would fill up this area perfectly.
For the normal distribution (instead of the Weibull distribution), this process is illustrated at
https://www.real-statistics.com/distribution-fitting/kernel-density-estimation/
Charles
I am confused whether I have to download your sofware or I can do it using Excel that comes with Microsoft office.
You can do much of it with Excel that comes from Microsoft Office, but many of the simpler approaches require the Real Statistics software.
Charles
Hi
Is it possible to use this method for other distributions? I currently use for the exponential, Weibull and log-logistic but would also like to use it for lognormal, generalised gamma and gompertz if possible.
Hello Keith,
Yes, it is possible to use a similar approach for some other distributions, but I have not yet implemented these as yet. The Maximum Likelihood approach has been implemented for a great many distributions, but not yet for generalized gamma and Gompertz.
Charles
Dear Charles,
Thanks for the great explanations
What about fitting nonlinear regressions by minimizing the least squares with Solver? Isn’t that an option for any regression, expanding from Weibull to Gompertz, Lognormal, Logistic etc?
Regards,
Ivan
Ivan,
Yes, you can use Solver for this purpose- I show how this is done for Exponential regression. See
Nonlinear exponential regression using Solver
Charles
Dear Charles,
thank you so much for your helpful example. I would like to extend it with a weigth ‘w’
where w := [(1-F(x))log(1/1-F(x)))]². I calculated the weigth factors but, since I am not an expert in statistics, I don’t really know at which point I would have to apply the multiplication with w.
Can you aid me on this one ?
Thanks and kind regards
Lucas
Hello Lucas,
What is the reason for using weight w?
Charles
Hello Charles,
the reason would be a stabilization of the variances across x. (Outweighing of a hetereoscedasticity)
Hello Lucas,
I am sorry, but I am not able to make the extension that you requested.
Charles
Hello Lucas,
thanks for trying! I will share a solution with you as soon as I found one.
Kind regards
Lucas
Thank you
Dear Charles, I really appreciate your explanation.
I’m trying to fit data to a distribution with the expression: a*(1-exp-(x/b)^c), and I found difficult to take care of the a parameter in the linealization of the expression. Do you have any ideas?
Thank you very much
Are you trying to create a linear regression model for y = a*(1-exp(-(x/b)^c)) ? If so, are a, b and c fixed constants or coefficients to be estimated?
Charles
Yes, a, b and c are coefficients to be estimated. I was trying to estimate them as you calculated alpha and beta in this post, but not sure about a.
Thank you very much
Andres,
I don’t know how to take care of the a coefficient using linear regression. You might need to use non-linear regression (e.g. using Solver or Newton’s method).
Charles
Dear Charles, thank you very much for your kind reply. I’m trying to fit my values using Newton’s method. Thanks
Dear Charles. Thanks a lot for the exercise. I have done it in stata as well and it is perfect for teaching Weibull’s distribution.
Just an additional question. Could you help me to get the fitted values but in it’s original “x” values? I had no problem in doing that with the exponential distribution, but I’ have been hours trying it for Weibull distributions but unfortunately can’t achieve them.
Regards
Hello Rodrigo,
The approach shown on this webpage are for the original x values. Here are two other approaches:
https://real-statistics.com/distribution-fitting/method-of-moments/method-of-moments-weibull/
https://real-statistics.com/distribution-fitting/distribution-fitting-via-maximum-likelihood/fitting-weibull-parameters-mle-newtons-method/
Charles
Hi. Is that possible to calculate 3 parameters in excel? How to insert the formula for that? Thank you very much for your help.
Hi Charles,
Would this work if I have more than one sample that has exactly the same value? i.e. x1 = x3 = x5 and x2 = x4 …etc.
I wouldn’t think that such a sample would be a fit for the Weibull distribution, but, in any case, I suggest that you try it out.
Charles
Charles,
Will you please check the logic included in the Real Stat Analysis Tool for the Weibull distribution with censored data? The alpha and beta rendered using the system produce the same alpha and beta values without censoring data.
Thanks,
-Sun
Sun,
Can you give me an example where the data analysis tool produces the same alpha and beta values with censored data and without censored data?
Charles
I used the same data provided in the example on the web with n=12, ncensor=2, and censor=900.
without censored data using the method of MLE:
alpha= 689.8070722
beta= 4.141937628
mean act = 624.25
mean est= 626.4900006
var act= 33779.11364
var est= 29001.55648
mle= -78.83963515
with censored data using the MLE and Sover:
alpha 755.03769
beta 3.55435801
n 12
m 2
T 900
MLE -83.50895892
with censored data using the Real Stat Analysis Tool with the censor options:
iterations 20
censor 900
count 2
alpha 689.8070752
beta 4.141937786
mean act 626.4605309
mean est 626.4900046
var act 29028.04921
var est 29001.55485
mle -78.83963518
Thanks,
-Sun
Hello Sun,
Sorry that it has taken me so long to respond. I started to look into this a few weeks ago, but then got distracted with other things. Using the latest version of the Real Statistics software, I get the following results when using =WEIBULL_FIT(A4:A15,TRUE,20,4,D4,D3) with censored data. These results are the same as the results from Solver but different from the non-censored case.
alpha 755.0382616
beta 3.554355741
mean act 678.6938455
mean est 679.9019237
var act 48784.89265
var est 45027.33003
mle -83.50895892
I can’t recall whether I made any changes to the software a few weeks ago based on your comments.
Charles
Many thanks for the wonderful site
How do we calculate life expectancy using Weill equation?
Huron
Hello Huron,
Perhaps the following webpage will be helpful in addressing your comment:
https://real-statistics.com/other-key-distributions/survivability-weibull-distribution/
Charles
Hi Charles,
Thank you so much for the Weibull Survivability webpage!!!
Another question, instead of ln(–ln(1–F)), couldn’t we just regress ln F – ln x to get Weibull parameters?
Huron
Hello Huron,
What is your justification for this?
Charles
Hi Charles,
I installed the Real Statistics Resource Package
latest version: 6.1 Excel 2010/2013/2016/2019/365 Windows
I use Excel 2013.
When I tried your example, x column in figure 1, using WEIBULL_FITR(B4:B15,TRUE,FALSE)
I get “alpha” in the cell but not additional number or text in other cells.
Thanks
Mario
Mario
Mario,
This function is an array function and so you need to use it in a slightly different way. See the following webpage for details:
Array Formulas and Functions
Charles
It appears that everything in Figure 2 is right, but there is a formula you give that doesn’t match the equation you used in Figure 2, cell H4.
Given:
ln(–ln(1–F(x))) = β ln x-β ln α
and
y=βx′+a
I understand that:
y = ln(–ln(1–F(x))) and
x′ = ln x
But should α = β ln x
actually be a = -β ln α,
which would yield and estimate for α as
α=exp[-a/β],
where a is the intercept of the regression line as you correctly display in Figure 2.
Dear Kevin,
Thank you for finding this error. I completely misstated the expression for the intercept a. I have now corrected this on the webpage. Please let me know if I have missed something else.
I really appreciate your help in improving the Real Statistics website and making it easier for people to understand the underlying concepts.
Charles
Thank you for this wonderful work on the Weibull distributions, as a reliability engineer this is really useful. The Abernethy book ‘The Weibull handbook’ provides a lot of insight into how engineers use Weibull. I would like to request that you produce some goodness of fit methods for the Weibull, but also show how this regression method may also be used with right censored data. I would like to see your work here reproduced in Python, especially using the Jupyter notebook formats so all of the explanations and formulas can be seen juxtaposed with the code. Would you give permission for this?
Charles,
Thank you for your kind words.
The website already includes goodness of fit methods. See
Anderson-Darling Test
Chi-square Goodness of Fit Test
I investigated using the regression approach for Weibull distributed data, including right censored data. I wasn’t entirely happy with the approach, and so I decided to perform this using the maximum likelihood approach. See
Weibull with Censored Data
Fitting Weibull Parameters via MLE
If you have a good reference for doing this via regression, I would be happy to look at it.
What sort of permission do you need to reproduce the Real Statistic work in Python?
Charles
Your permission to make any python code using the methods you describe in your site (not Python calling excel) freely available on Github. Obviously, if I do anything I would acknowledge you and this website.
Dear Charles,
I am quite pleased that the code that you created was based on things that you learned from the Real Statistics website and would be honoured to get your acknowledgement.
Charles
x ln(x) F(x) ln(F(x)) ln(-ln(1-F(X)))
1 315 5.752572639 0.041667 -3.178046 -3.156841
2 386 5.955837369 0.125 -2.079442 -2.013419
3 487 6.188264123 0.208333 -1.568618 -1.454083
4 509 6.232448017 0.291667 -1.232143 -1.064672
5 512 6.238324625 0.375 -0.980829 -0.755015
6 613 6.418364936 0.458333 -0.780159 -0.489221
7 680 6.522092798 0.541667 -0.613104 -0.248257
8 725 6.586171655 0.635 -0.454130 0.007827
9 753 6.624065228 0.708333 -0.344841 0.208755
10 811 6.698268054 0.791667 -0.233614 0.450195
11 848 6.742880636 0.875 -0.133531 0.732099
12 872 6.770789424 0.958333 -0.042560 1.156266
Hi Charles,
Sorry I could not paste the chart .
Just thought that would power law ln- ln chart be an alternative for regressing failure -time? Much appreciate your comments.
Hello Huron,
I still don’t understand why the alternative approach that you suggested is justified.
Charles
This looks very interesting and rather an advance on my more primtive OLS fitting in Excel.
One problem I’ve been struggling with is to estimate precision around Weibull (and other distribution) parameters for right censored and full data sets.
Does/ Could your package permit estimation of SEs for alpha beta (or lambda(slope) gamma(shape) as I would call from (from Collett 2004)? I read somewhere that MLE can be used to this purpose…
Thanks
Hello Jack,
This is an excellent question. I know of three methods for estimating the standard error and confidence intervals for distribution parameters: (a) exact method (can only be used for a few distributions), (b) an approach based on some large sample properties and (c) simulation.
Real Statistics currently only provides support for (a), but this is not applicable for most distributions.
I plan to add support for (c) shortly (probably in the next release) and maybe even (b).
Charles
This was quite helpful, in getting started on developing a solution in Excel for creating Weibull plots. I wanted to understand the underlying estimator and regression. It is helpful to note that the formula used to estimate the values of F(x) in column E belongs to the method of symmetric cumulative distribution function. There are other possible estimators, such as the mean rank and median rank (used by Dorner, 1999). To get a look into the math of the estimator and regression methods, see the 2014 paper “A Comparison of Methods for the Estimation of Weibull Distribution Parameters” by Nwobi and Ugomma. It is freely available online. They conclude that the mean rank (MR) gives the best estimates for a two-parameter Weibull distribution, and that the maximum likelihood estimation (MLE) is preferable over the method of moments and least-squares methods. Good stuff!
The Excel implementation I come up with should be freely available, so I will post a link here to my solution once it is finalized.
Mike,
Thanks for sharing this with us. I will look into the paper that you referenced.
Charles
I m quite confused about the terminology. Are the least square, the graphical and the regression method all the same as stated above ?
Thanks
Rali,
Yes, they are all related. Least squares is the type of regression. The graph is a way of seeing whether the data aligns with a straight line.
Charles
ignore the upper comment, i was doing mistake
Hello i am following your website and found it very useful but at some place got some confusion. for the X values 308,362,364,376,470,470. Now if we go by the suggestion given in figure 2, it has different results while from WEIBULL_FITR it is giving different results… am i missing something ?
Weibull_FLTR Excel native formula
alpha 419.0054967 510.1082484
beta 6.764077297 5.401703329
mean act 391.6666667 391.6666667
mean est 391.2498584 470.4495904
var act 4232.666667 4232.666667
var est 4605.423387 10080.40283
mle -33.48598565
r-sq 0.875813349 0.835018325