We show how to estimate the parameters of the Weibull distribution using the maximum likelihood approach. The pdf of the Weibull distribution is
![]()
and so
Maximizing L(α, β) is equivalent to maximizing LL(α, β) = ln L(α, β). Now


We can now use Excel’s Solver to find the values of α and β which maximize LL(α, β).
Example 1: Find the parameters of the Weibull distribution that best fit the data in range A4:A15 of Figure 1 (i.e. repeat Example 1 of Method of Moments: Weibull Distribution using the MLE approach).
We use Excel’s Solver to maximize LL(α, β) by selecting Data > Analysis|Solver, and then filling in the dialog box appears as shown in Figure 1.
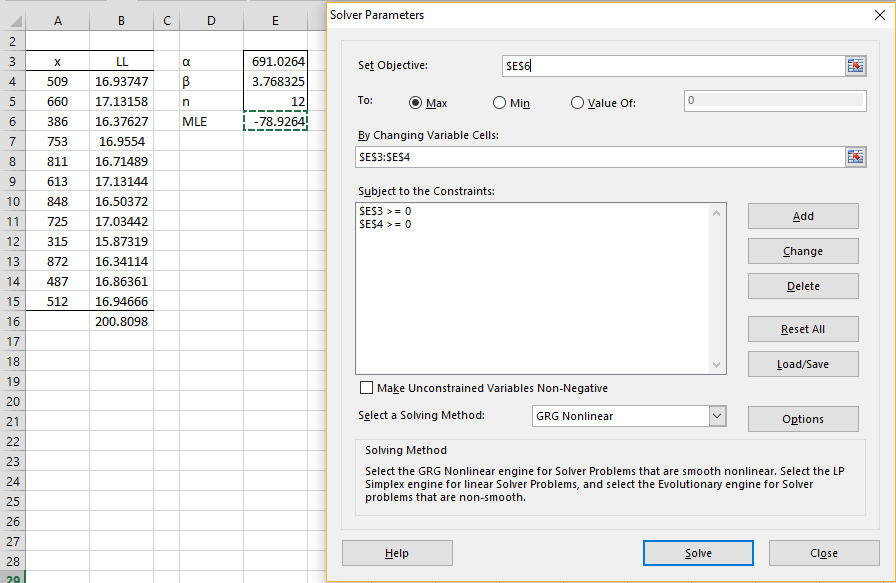
Figure 1 – Calculating the Weibull parameters using Solver
Prior to using Solver, we place the formula =($E$4-1)*LN(A4)-(A4/$E$3)^$E$4 in cell B4, highlight the range B4:B15 and press Ctrl-D. Next we place the formula =SUM(B4:B15) in cell B16, the formula =COUNT(A4:A15) in cell E5 and the formula =E5*(LN(E4)-E4*LN(E3))+B16 in cell E6, and then we initialize cells E3 and E4 with the results from Figure 2 of Method of Moments: Weibull Distribution, i.e. alpha = 691.0264 and beta = 3.768325.
Upon pressing the OK button, the results shown in Figure 2 appear.

Figure 2 – Weibull parameters based on MLE
Examples Workbook
Click here to download the Excel workbook with the examples described on this webpage.
References
Forbes, C., Evans, M., Hastings, N., Peacock, B. (2011) Statistical distribution. Wiley
https://www.academia.edu/49056503/Statistical_distributions
Cohen, A. C. (1965) Maximum likelihood estimation in the Weibull distribution based on complete and on censored samples
https://www.stat.cmu.edu/technometrics/59-69/VOL-07-04/v0704579.pdf
Millard, S. P. (2023) Estimate parameters of a Weibull distribution
https://search.r-project.org/CRAN/refmans/EnvStats/html/eweibull.html
Hello,
I am wondering if you have a derived equation for the maximum likelihood to estimate a three-parameter Weibull?
Thanks,
Mark
Hello Mark,
No, I haven’t provided this capability yet.
I will add something on this topic though in the next release.
In the meantime, see
http://www.mapageweb.umontreal.ca/cousined/home/others/distrifitting/docs/31_fitweibull_vieee_vproofs.pdf
Charles
With the new LET function (Obtained with Office Insider and if you use Calibri Font for example to have α … ) we have only to paste this line:
French:
=LET(α;E$4;β;E3;x;A4:A15;SOMME(LN(LOI.WEIBULL.N(x;α;β;0))))
English something as:
=LET(α,E$4,β,E3,x,A4:A15,SUM(LN(WEIBULL.DIST(x;α;β;0))))
(… It could be corrected and extended for censored data)
Have you ideas: how to launch the solver in a function as “LET” with the parameters of the solver ? (The solver is not a function, it could be a function ?)
Thanks in advance
There are a number of Solver-oriented functions: SolverOK, SolverAdd, etc. See
https://learn.microsoft.com/en-us/office/vba/excel/concepts/functions/solverok-function
Charles
I have found on the web clearly the problem :
With a macro we can use le solver :
” Sub mySolverSub()
SolverReset
SolverOk SetCell:=”C4″, MaxMinVal:=3, ValueOf:=2, ByChange:=”C3″
SolverSolve (True)
End Sub ”
The problem is to be able to have a function something like :
Function mySolverF()
SolverReset
SolverOk SetCell:=”C4″, MaxMinVal:=3, ValueOf:=2, ByChange:=”C3″
SolverSolve (True)
mySolverF = Range(“C3”).Value
End Function
…. the function mySolverF does work correctly when called from a sub, e.g.
Sub mySolverSub2()
res = mySolverF()
MsgBox “mySolverSub2:res=” & res
End Sub
… but this is not quite what I want, because it still requires creating + pushing a button instead of being invoked automatically like a proper function. ”
See :
https://stackoverflow.com/questions/72576008/invoke-excel-solver-through-a-vba-function-rather-than-a-sub-macro
No more ideas 😉
Thanks to your answer
It does seem like Microsoft made it difficult (impossible?) to create a worksheet function that uses Solver. In fact, in the past I was forced to use a subroutine that was called from a menu. When I needed a worksheet function, I had to reinvent a Solver-light capability.
Charles
Hi Charles
I’m struggling with Weibull distribution, my excel file is not ending up. Please send me an email.
Thank you
Hi Haidula,
What problems are you having?
Charles
Hello Charles
Can you explain the reason why multiplying all the function values generates the likelihood? I have read the other articles about MLE and can’t find an explanation for that definition.
Further on, i don’t understand why you take the log of the likelihood function? Why can’t you just insert the formula with the multiplication in Excel and use the solver function? Is it only to reduce calculation time?
Thanks in advance
Kevin
Hi Kevin,
If you assume that the sample elements are chosen independently, then the probability that this particular sample is chosen is equal to the product of the probability for each element. P(A & B) = P(A) x P(B).
If you are using Solver then, as you say, there isn’t a big advantage of taking the log. The only benefit could be with very large numbers since the product of such values might lead to overflow (i.e. a value too big), while the logs of the values are smaller and adding will produce smaller results than multiplying. If you are using other approaches (such as Newton’s method), then using the log simplifies the calculations.
Charles
Thanks Charles for the answers.
Kevin
Kevin,
Glad I could help.
Charles
I just noted that in this definition of the Weibull function the role of alpha and beta is reversed compared to the Excel Weibull.dist() function. At first I tripped over this and couldnt understand why the calculated Fit is “so bad”, but after exchanging the values in Weibull.dist it now makes sense.
Jens,
Yes, unfortunately, Microsoft reversed the roles of alpha and beta in Excel.
Charles
How do you calculate the R-square of the resulting parameters when using this method?
Alberto,
R-square is related to correlation and regression. I don’t know how R-square would be related to the Weibull parameters.
Charles
I do like the idea of using the Excel solver to find the best-fit values. (Need to make sure it doesn’t home in on a local minimum I guess.)
I agree that there isn’t a generally accepted definition of r^2 for the Weibull distribution. However, what is often done is that the results are plotted on a Weibull plot. If you “linearise” the axes, you can then work out an r^2 value. There are some criterea published for estimating whether data is a “good fit” using this approach essentially by finding whether it is within a defined confidence limit.
John,
You can do this using the regression approach to estimating the fit as described at
https://www.real-statistics.com/distribution-fitting/fitting-weibull-regression/
Charles
Hi Charles. Does using the solver give us a result closer to the shape and scale parameters than with linear regression? I would like to use this method to calculate failure probabilities. Thank you so much for the valuable Weibull Excel tips.
Hello Diogo,
For the example given on the website, the Solver approach yields better estimates than the regression approach. This is because the log-likelihood estimate is lower (-78.8396 vs. -78.9156). I don’t know whether this is true in general, but it probably is.
Charles
Hi Charles! I succeeded to create the spreadsheet! However, I have one more question. Is the confidence interval applied to the LL(alpha,beta) values or to the time-to-failure data itself? Because using Excel’s Regression, it generates the r, the intersection, the p-value and other results. Thank you so much!
Hi Diogo,
I don’t see any confidence interval on this webpage. What confidence interval are you referring to?
Charles
Why is the order of alpha and beta reversed in EXCEL’s WEIBULL(xi, beta, alpha, cumultive) function?
Ron,
I don’t know. Perhaps they just made a mistake.
Charles
Hello Chales,
Hope you are doing Great!
CAn you please provide me with this exact excel where you have done the MLE analysis?
Hello Bhanu,
You need to download the Distributions examples workbook from the following webpage
Real Statistics Examples WorkbooksReal Statistics Examples Workbooks
Charles
how are you Mr Charles?
how do I download the excel file?
See https://real-statistics.com/free-download/real-statistics-resource-pack/
Charles
nice stuff
Hi Charles, is the MLE is the same as Extreme Value using Weibull? I have some measurements and I want to predict the maximum measurement that can be reached over certain period of time – is this the way to do it?
Sorry, but I don’t understand your question. Extreme Value is a distribution that has some relationship to the Weibull distribution (via the Generalized Extreme Value distribution), but I don’t know if this is what you are referring to.
Charles
Thanks Charles,
Yes I was referring to the Extreme Value Distribution and its relation to the Weibull Distribution. I have some corrosion data that I need to predict the maximum value it can attain. I have seen some work online done and I am not aware how to do that!
Sorry, but I am not an expert on the Extreme Value distribution and so I don’t know the relationship between MLE and the Extreme Value distribution (probably the Maximum Extreme Value distribution).
Charles
Hello charles,
How to estimate the t-value for the coefficients of the parameters and log likelihood using your method.
Sorry Yonas, but I don’t understand your question. What coefficients are you referring to?
Charles
I believe Yonas (and I) want to compute confidence intervals for the Weibull parameters obtained through maximum likelihood analysis. Similarly, and especially, I want to obtain the confidence band and prediction band. (These bands are hyperbolic for least squares regressions, as you know). I greatly appreciate any words you may offer on these matters.
Hello Scott,
See https://www.real-statistics.com/distribution-fitting/distribution-fitting-confidence-intervals/
Charles
Hi Mr charles, don’t you have videos on how to estimate the shape and scale parameters of wind data using the maximum likelihood method in excel? or please do recommend any website for this.
I have wind data from 2013-2018 and I am struggling to get estimate the parameters.
I am sorry but I don’t have a video for this. I plan to add some videos but so far had not had the time to do so.
This webpage is designed to tell you how to estimate the shape and scale parameters. Do you have any specific questions that I can help you with?
Charles
Charles,
The example we have here has one unique time for each sample. What would happen if there are more than one sample for some time points? What modification we do need to make to fit the Weibull distribution on such survival data.
I understand that you had mention that di=1 at ti is the assumption we set early.
Thanks,
-Sun
Sun,
Are you referring to fitting a Weibull distributions via MLE to a data sample? If so, you can have multiple sample elements with the same values.
Charles
Just to be sure I understand what you said… No matter how many samples failed at the same time point, estimating the Weibull distribution parameters (ie, the method described on the website) won’t be affected as long as I have the multiple same failure times presented in the data.
Is this correct?
Hello Sun,
I believe that your assertion is correct, but the I am assuming that you are simply stating that the approach described on this webpage is suitable even if there are repetitions in the data.
Charles
Charles,
Under the fitting Weibull parameters using MLE and Newton’s Method, there is a typo in calculating the beta(k+1) value. The ratio of h(beta) and h'(beta) should be subtracted from beta(k) instead of 1.
I have one question for you. Is it true the sum(t/alpha)^beta is always the same as the number of sample (uncensored)? In this specific example, the calculated value is the exactly same as n=12. And the formula for cell D8 and K16 (ie, MLE) implies that the summation value is the same as the sample size (ie, D6). I do appreciate your input.
Thanks,
-Sun
Sun,
1. Thanks for finding the error in the formula for the iteration of the beta values. I have corrected this on the website.
2. Are you referring to formulas on this webpage or some other?
Charles
The page I found the errors do not have the comment field I can report the issue.
There are two locations on this web page where the formula of beta (k+1) was incorrectly described:
– Fitting Weibull parameters using MLE and Newton’s method
– Weibull with censored data
Best,
-Sun
Hello Sun,
Are both webpages now correct?
Charles
Yes, you have corrected them all.
Thanks,
-Sun
Sun,
I see now that your second comment refers to
https://real-statistics.com/distribution-fitting/distribution-fitting-via-maximum-likelihood/fitting-weibull-parameters-mle-newtons-method/
Are you asking whether =SUM((A4:A15/D3)^D4) has the same value as D6 and that this is true not just for this example but in general?
Charles
Yes, that was my question as it seems that it is too good to be true for generalization.
-Sun
Hi Sun,
I haven’t really had the time to look into this. It seems a bit strange, but I might be wrong.
Charles
Hi Charles, I have dataset of 1000 data-points. Can you tell me how do i go about estimating the parameters for pareto distribution by the method of Maximum Likelihood estimator using Solver Add-in?
Hello Dharmil,
The approach is the same as for the Weibull distribution, but you must first calculate the maximum likelihood estimator. This is not yet supported in Real Statistics, but you should be able to find it using google.
Charles
Hi Charles, I was wondering in the case were we are useing the mle to solve for the parameters of the Weibull, shouldn’t we be minimising the log likelihood not maximising
Hi Charlie,
No, we should be maximizing it. Why do you think it should be minimized?
Charles
Hey charles I need help in cross checking a weibull data from review article. How do I plot in excel if I don’t have the values. Any simple steps to proceed.
Hello Ryan,
You either need the data or the Weibull parameters to create such a plot in Excel (or using any other tool). Alternatively, you can use other information that allows you to determine the parameters.
Charles
I do have weibull parameters I need help. Is there any way I can mail you details and ask you some doubt.
Hi Ryan,
You can email me an Excel file. See Contact Us.
Charles
Hello Ryan,
What do you have? Do you have the Weibull parameters?
Charles
This is really good work thank you. I have a suggestion: Your treatment of censored data may be limiting. It allows you to define an age, and then the number of components that have survived to that age. In an applied use-case where Weibull is used to determine the age/failure pattern of components being run operationally (not a design life-test), then components that have planned restorative or replacement maintenance generate right censored data (or suspensions), where the ages of each observation may vary.
Charles,
Can you recommend an online reference that describes this situation in more detail?
Charles
Hey Charles,
Sorry for the delay, please take a look at this. http://reliawiki.org/index.php/The_Weibull_Distribution
Thanks Charles for sending this to me. I will take a look at.
Charles
Thanks, Do you have any plan of putting this technique step by step on your webpage like the current webpage so that we can walk along with instructions.? I will wait for this release.
Yes, I will.
Charles
hi when will be the mle with censored data be available?
Hello Charles,
i need to do the same estimation via MLE but i have the right censored data only. By now few unit has failed out of total units in field. How to do achieve the parameter for population from censored data? i have also searched over various places but could not find anything conclusive.
One place where i found relevant information but not able to implement as on my data the formula gives error. i hope you will help me out
http://www.epixanalytics.com/modelassist/AtRisk/models/Weibull_right_censored.xls
Jain,
Good timing. I have already added censored data to fitting Weibull parameters. This will appear in the next release of the Real Statistics software (Rel 5.4) and should be available in a couple of days.
Charles