We can use the maximum likelihood estimator (MLE) of a parameter θ (or a series of parameters) as an estimate of the parameters of a distribution. As described in Maximum Likelihood Estimation, for a sample the likelihood function is defined by
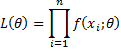
where f is the probability density function (pdf) for the distribution from which the random sample is taken. Here we treat x1, x2, …, xn as fixed. The maximum likelihood estimator of θ is the value of θ that maximizes L(θ). We can then view the maximum likelihood estimator of θ as a function of the sample x1, x2, …, xn.
Topics
- Exponential Distribution
- Weibull Distribution (using Solver)
- Weibull Distribution (using Newton’s method)
- 3-Parameter Weibull Distribution
- Gamma Distribution
- Beta Distribution
- Negative Binomial Distribution
- Uniform Distribution
- Triangular Distribution
- PERT Distribution
- Binomial Distribution
- Poisson Distribution
- Normal Distribution
- Lognormal Distribution
- Gumbel Distribution
- Logistic Distribution
- Laplace Distribution
- Pareto Distribution
- Geometric Distribution
- Cauchy Distribution
- Generalized Extreme Value (GEV) Distribution
- Generalized Gamma Distribution
- Weibull Distribution with Censored Data
- Weibull Distribution with Multi-Censored Data
- Real Statistics Support
Reference
Wikipedia (2017) Maximum likelihood estimation
https://en.wikipedia.org/wiki/Maximum_likelihood_estimation
Hi. I would like to determine the statistical distribution for the monthly number of insolvencies during a year. Obvisouly, it is a seasonal cycle but I cannot figure out how to fit it to a distribution. Do you have any suggestion on which distribution it could fit? Or any tool I could use to determine it?
Thank you for your help.
Hi Tahar,
You can fit it to a variety of known distributions and see which one has the best fit, but since you said that your data shows seasonality, this approach is not likely to be productive since the usual distributions don’t display seasonality.
Let’s start over again. Why do you want to fit the data to a distribution? If you want to make predictions about future numbers of insolvencies, then you could treat the data as a time series with seasonality. You can now use various techniques to build a model that fits the data, such as regression with seasonality, Holt-Winters and SARIMA, all of which are explained on the Real Statistics website.
Charles
hello master how are u I need to use weibull analysis with breakdown voltage test but I have 6 date of test for example 40,50,55,60,62,70, and avarege can I use it to estimate the weibull distribution and how can i estimate the shape and scale parameter
Yes, you can use this approach to estimate the shape and scale parameters for a Weibull distribution. In fact, three different approaches are described on the Real Statistics website to accomplish this: method of moments, maximum likelihood and regression.
Charles
Hi Mr chares,
I have wind data from 2012-2018, how do i determine the Weibull parameters? please help.
Go to https://real-statistics.com/distribution-fitting/distribution-fitting-tool/
Charles
I have a population organized by age. For example at age 60 I have a 1000 death and 200o alive. At 61 the same idea till 90 years old. How can I adjust a reliable weibul distribution determining the parameter and also a gompertz. Could you please send me an excel so I can understand the procedure more easily…
Regards
Rodrigo,
Sorry, but I don’t understand your question. Are you looking to fit some data to a Weibull distribution? If so, see
Distribution Fitting
Real Statistics doesn’t support the Gompertz distribution yet.
Charles
Hi Charles, how are you?
Charles, I have a questions about how do you include the censored data when using MLE or Moments Methods? When using MRR, we have N(Number of samples) that impacts the parameters.
For Example:
Data–Failed/Censored=Still running
6 F
6 C
6 C
6 C
7 C
9 F
10 F
10 C
11 F
13 C
16 C
17 F
19 F
20 F
22 C
23 C
25 F
32 F
32 F
34 F
35 F
Using Median Rank Regression N=21 (sample size) and only the failed data the parameters are:
B=1.63, Eta=40.11
R2=0.95
Using MLE, N=12 (Because the Solver gives error if I use 21)
B=2.22
eta=23.60
Using MOM, N is not used as a number, just use the 12 failed items data.
B=2.06
eta=23.52
My question is why is the parameter eta so different? How do you include the censored data in the MLE/MOM method?
Thanks for you answers!
Miguel,
Thanks to your comment, I have decided to implement Weibull distribution fitting even when there is censored data. This will be added when I issue the next software release.
Charles