Basic Concepts
The Wald-Wolfowitz two-sample runs test is used to determine whether two samples come from the same distribution. The test orders the values in the combined sample, creating a sequence of symbols 1 (if the value comes from sample 1) and 2 (if the value comes from sample 2), and then using the one-tailed version of the one-sample runs test.
If there are ties, then the number of runs will differ depending on how the 1’s and 2’s for the tied values are ordered. In this case, we perform multiple versions of the test, randomly changing the order of the 1’s and 2’s with tied ranks.
Note that when there is a significant difference between the distributions of the two samples, we can’t tell whether this is a difference in means, medians, variances, skewness, kurtosis, etc.
Example
Example 1: Determine whether the samples in ranges B4:B11 and C4:C10 of Figure 1 come from the same distribution.
First, we rearrange the input data as shown in range E4:F18. Essentially, we are creating a stacked version of the original data in column E, labeling the data from sample 1 with a 1 in column F, and labeling the data from sample 2 with a 2 in column F.
Next, we sort the data, putting the results in range H4:I18. We can do this by using the array formula =QSORTRows(E4:F18,1).
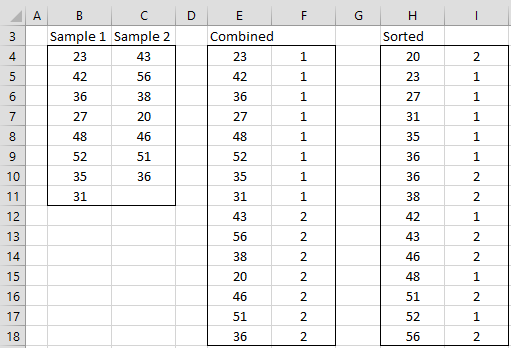
Figure 1 – Data for Two-Sample Runs Test
We next use the array formula for the one-sample runs test=RUNSTEST(I4:I18,TRUE,1) to obtain results similar to those shown in range K4:L11 of Figure 2.
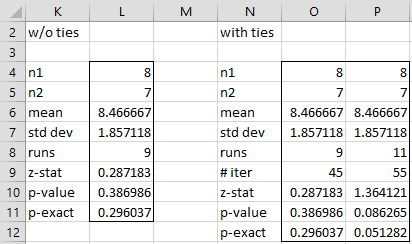
Figure 2 – Two /Sample Runs Test
Note that the value 36 appears twice in the original data, as shown in Figure 2, once in sample 1 and again in sample 2. When the data is sorted, we see that 36 appears in cells H9 and H10. The order shown in column I is the one that produces the fewest number of runs (namely 9). However, if the values in cells I9 and I10 are interchanged, the number of runs increases by 2 to 11. Thus, there are two possible outcomes, as shown in range N4:P12 of Figure 2.
Worksheet Function
We can simplify the calculations by using the following Real Statistics function.
Real Statistics Function: The following array function is provided in the Real Statistics Pack:
RUNS2TEST(R1, R2, lab, iter): outputs a 9 × 1 column range as shown in range L4:L11 of Figure 2 with the results of the two-sample runs test on the data in ranges R1 and R2 if lab = FALSE (default) and a 9 × 2 column range, including labels, as shown in range K4:L11 if lab = TRUE.
In the above, iter = 0 (default); the default value is used if there are no ties or we are willing to accept a random (actually semi-random) ordering of the 1’s and 2’s for the tied values.
Handling Ties
If we are not willing to accept the default output, we ask the function to randomly change the order of the 1’s and 2’s for the tied values iter number of times. For Example 1, if we set iter = 100, we see from the right side of Figure 2 that the runs = 9 case occurs 45 times and the runs = 11 case occurs 55 times. Note that the p-values for these two cases are different.
For Example 1, the array formula =RUNS2TEST(B4:B11,C4:C10,TRUE) can be used to obtain the output shown in range K4:L11 of Figure 2.
If instead, we use the array formula =RUNS2TEST(B4:B11,C4:C10,TRUE,100) we obtain the output shown in range N4:P12. In this case, we know that there are 2 possible outcomes, and so we need to highlight a 9 × 3 range for the output. In general, some guesswork might be required to determine how large a range to use for the output. After seeing the output, you might have to increase the size of the output range. Also note that since the orders are randomly generated, the results are likely to be different on successive runs of the formula.
Data Analysis Tool
You can also use Real Statistics’ Non-parametric Tests data analysis tool to perform the runs test. Click here for additional information.
Examples Workbook
Click here to download the Excel workbook with the examples described on this webpage.
Links
References
NIST (2012) Runs test for detecting non-randomness
https://www.itl.nist.gov/div898/handbook/eda/section3/eda35d.htm
Zar. J. H. (2010) Biostatistical analysis 5th Ed. Pearson
I got a p value of 1e-16 which seems way too small. Does this mean I did something incorrectly?
This number is written in scientific notation and is equal to 1/10^16, which is very close to zero.
Charles
Thx sir for your posting very good. How about if we have ,n1=9 and ,n2=21,runs=13. Whose that n1 is value that low from median. So,what the runs table should i use? Thanks
Nur,
You can translate the problem into a one-sample runs test, as described on the referenced webpage and then use the one-sample normal approximation as described on the webpage
https://real-statistics.com/non-parametric-tests/one-sample-runs-test/
This is the general approach for critical values outside the range in the table.
Charles