Overview
Assume that we have a random sample S = {x1, …, xn} and^θ is the estimate of some parameter θ based on this sample using some function f(S).
Now define S(i) to be S with xi removed and^θ(i) = f(S(i)) to be the estimate of θ based on the sample S(i). The jackknife sample consists of the set^θ(1), …,^θ(n). We also define the jackknife estimate^θ(0) of θ to be the mean of the jackknife sample
![]()
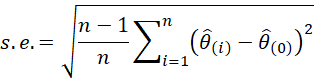
The jackknife can be used to estimate the standard error of the estimate as the population standard deviation of the jackknife sample multiplied by the square root of n–1
Acceleration
The acceleration coefficient is defined based on a jackknife sample by
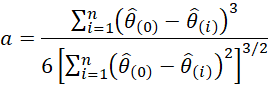
We will use the acceleration to create the biased-corrected and accelerated (BCa) bootstrap confidence interval. See Bootstrapping for more information about acceleration.
Worksheet Function
Real Statistics Function: The Real Statistics Resource Pack provides the following lambda array function.
JACKKNIFE(R1, expression, ref): returns a column array with the jackknife sample for the data in R1 based on the function f(arr) on a variable arr that takes array values; expression is used to specify f, and ref is an optional reference to arr.
Acceleration(R1, expression, ref) = the acceleration for the sample data in R1 based on the function f(arr) on a variable arr that takes array values; expression is used to specify f, and ref is an optional reference to arr.
If R1 is a column array, then its elements xi are those in the sample S. If R1 is an array with multiple columns, then the same approach is used except that now the elements xi represent rows in R1.
See Real Statistics Lambda Capabilities for additional information about lambda functions.
Example
Example 1: Use the jackknife to estimate the standard error of the mean based on the data in column B of Figure 1.
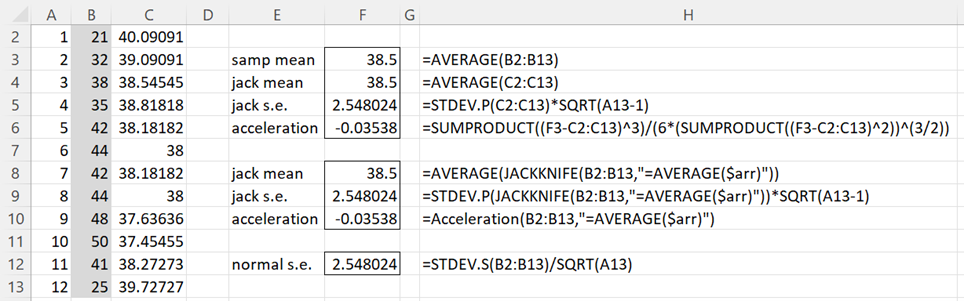
Figure 1 – Jackknife example
The parameter θ is the population mean, and the sample S is the set of elements in range B2:B13. The elements in column C consist of the means of the S(i). This can be done by placing the array formula =AVERAGE(DELROW(B$2:B$13,A2)) in cell C2, highlighting range C2:C13, and pressing Ctrl-D. DELROW is a Real Statistics function. If you want to use only Excel functions, you can place the formula =AVERAGE(B3:B13) in cell C2 and =AVERAGE(B2:B12) in C13. Next, you place the array formula
=AVERAGE(INDEX(B$2:B$13,A$2):INDEX(B$2:B$13,A2),INDEX(B$2:B$13,A4):INDEX(B$2:B$13,A$13))
in cell C3, highlight range B3:B12 and press Ctrl-D. Of course, you can also use the JACKKNIFE function, by placing the array formula
=JACKKNIFE(B2:B13,”=AVERAGE($arr)”)
in range B2:B13. Since JACKKNIFE is a lambda function, there are many alternative formations, such as =JACKKNIFE(B2:B13,”=AVERAGE(arr)”,”arr”).
Note that the jackknife mean (cell F4) is equal to the sample mean (cell F3). This won’t always be the case, though (e.g. if f(S) = the variance of S). The standard error of the mean is shown in cell F5. We can also obtain the standard error of the mean by using the JACKKNIFE function, as shown in cell F9. We will explain the acceleration value shown in cells F6 and F10 shortly.
Since the data in column B is approximately normally distributed (p-value = .3387 for the Shapiro-Wilk test), we expect that the standard error of 2.548024 (cell F5) will be quite close to the usual normal approximation of 2.548024 as calculated by =STDEV.S(B2:B13)/SQRT(COUNT(B2:B13)). In fact, for θ = the population mean, they are exactly the same. Again, this won’t always be the case for other population parameters.
Example using a multicolumn array
Example 2: Use jackknifing to estimate the standard error of the population correlation coefficient based on the sample of 8 subjects with measures before and after an intervention, as shown in range B2:C9 of Figure 2.
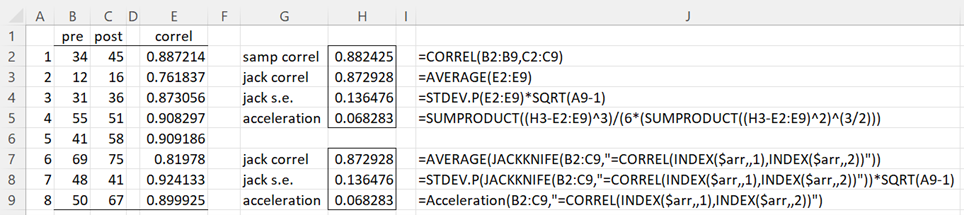
Figure 2 – Jackknife standard error for correlation
The correlation coefficient for the sample data is .882425 (cell H2), indicating a high degree of correlation. We estimate the standard error for the correlation using the jackknife sample shown in column E. We can obtain these values by inserting the array formula
=CORREL(INDEX(DELROW(B$2:C$9,A3),,1),INDEX(DELROW(B$2:C$9,A3),,2))
in cell E2, highlighting range E2:E9, and pressing Ctrl-D. Alternatively, we can insert the lambda formula
=JACKKNIFE(B2:C9,”=CORREL(INDEX($arr,,1),INDEX($arr,,2))”)
in cell E2. Note that the delete-one-element approach is applied one row at a time to the array B2:C9.
We see that the standard error is estimated to be 0.136476 (cell H5 or H8). Note that this time the sample correlation and jackknife correlations (H2 and H3) are different.
Examples Workbook
Click here to download the Excel workbook with the examples described on this webpage.
Links
References
DiCiccio, T. J., Efron, B. (1996) Bootstrap confidence intervals.
http://staff.ustc.edu.cn/~zwp/teach/Stat-Comp/Efron_Bootstrap_CIs.pdf
Efron, B., Tibshirani, R. J., (1993) An introduction to the bootstrap. Springer
https://books.google.it/books/about/An_Introduction_to_the_Bootstrap.html?id=gLlpIUxRntoC&redir_esc=y
Thank you, Charles, for the information and the links.
Marcel
Hello Charles Zaiontz,
1) I downloaded the Jackknife Workbook and this worked fine, with the exception that $arr is not defined and the second set of results cannot be shown. I guess its quite basic, but I have not yet used predefined $-variables.
2) How can one obtain in your example an estimate for e,g, a linear regression with its estimated error for slope and intercept?
Thanks
Marcel
Hello Marcel,
1) $arr is a kind of dummy variable. You can call it anything you want. If the dummy variable begins with a $ then it is easier to use. I chose to call it $arr so you would recognize it as an array. Here I am using Real Statistics’ lambda capabilities. It is essentially a simplified version of Excel’s lambda capabilities which have recently been added by Microsoft to the latest version of Excel. Essentially, it allows a function to call another function as a variable. This isn’t so easy to understand for those who aren’t already familiar with the concept. It is, however, very powerful and useful.
You really need to review the following webpage before using the JACKKNIFE worksheet function:
Real Statistics Lambda Capabilities
2) I am not sure what regression you have in mind since there is only one variable. In any case, the following webpage describes how to use jackknifing for Deming regression. Perhaps this will be helpful.
https://real-statistics.com/regression/deming-regression/jackknifing/
Charles