Basic Concepts
Given n subjects, each of whom is given two treatments, where the result of each treatment is assigned one of k categories (including the case where there is only one treatment, but each subject is in one of k categories prior to treatment and one of the same categories after the treatment). This situation can be represented as a k × k contingency table with entries nij, which sum up to n, where nij = the number of subjects that are in category i after treatment 1 and category j after treatment 2 (or category i prior to treatment and category j after treatment).
The null hypothesis is that nij = nji for all i, j (or equivalently that pij = pji for all i, j where pij = nij/n. This is equivalent to saying that the matrix that consists of the contingency table is symmetric.
If the null hypothesis is true, then the McNemar-Bowker statistic follows a chi-square distribution, as follows:
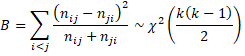
This is known as the McNemar-Bowker test. It is an extension of McNemar’s test described in McNemar’s Test.
Example
Example 1: A hormone is administered to 150 turtles with the hope that the turtles will run fast after the treatment. Each turtle is judged to be in one of three categories (below normal speed, at normal speed, or above normal speed). The contingency table for this sample is shown on the left side of Figure 1. Determine whether there is a significant change in the speed of the turtles after hormone treatment.
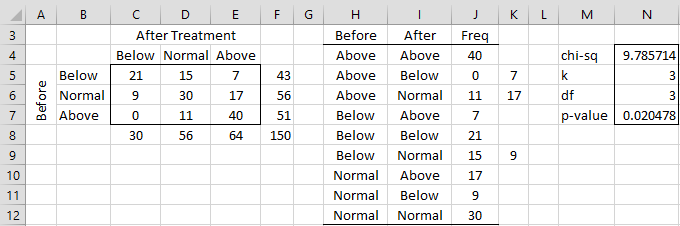
Figure 1 – McNemar-Bowker Test
We are essentially comparing three pairs of cells D5 with C6, E5 with C7, and E6 with D7. In each case, the number in the first cell is higher than that in the second cell, but is this difference sufficient to yield a significant result?
For this example, k = 3 and so df = k(k–1)/2 = 3. The test statistic is
![]()
Since p-value = CHISQ.DIST.RT(9.7857,3) = .0205 < .05 = α, we conclude there is a significant difference after treatment.
We now describe how to carry out these calculations in Excel. First, the contingency table is converted into standard (stacked) format, as shown in range H3:J12 of Figure 1. This can be done manually or by placing the Real Statistics array formula =QSORT2Rows(Anova2Std(B4:E7),1,2) in range H3:J12.
Next, place the formula
=IF(H4<I4,SUMIFS(J5:J$12,H5:H$12,I4,I5:I$12,H4),””)
in cell K4, highlight the range K4:K11 and press Ctrl-D. Now place the formula =COUNT(C5:C7) in cell N5, the formula =N5*(N5-1)/2 in cell N6 and the following array formula in cell N4.
=SUM(IF(K4:K11=””,””,(J4:J11-K4:K11)^2/(J4:J11+K4:K11)))
The p-value in cell N7 is calculated by the formula
=CHISQ_DIST_RT(N4,N6)
Real Statistic Support
Real Statistics Functions: The Real Statistics Resource Pack provides the following functions that perform the McNemar-Bowker test automatically:
BOWKER(R1, std) = the McNemar-Bowker test statistics for the data in array R1.
MBTEST(R1, std) = the p-value of the McNemar-Bowker test statistics for the data in array R1.
If std = FALSE (default), then the data in R1 is represented as a contingency table without headings; if std = TRUE, then data in R1 is represented in standard format with three columns, the first two columns contain the category names for the two treatments, and the third column contains the corresponding frequencies.
The test statistic for Example 1 can be calculated either by =BOWKER(C5:E7) or =BOWKER(H4:J12,TRUE). The p-value can be calculated either by =MBTEST(C5:E7) or =MBTEST(H4:J12,TRUE).
Examples Workbook
Click here to download the Excel workbook with the examples described on this webpage.
Links
Reference
Hintze, J. L. (2019) Test for multiple correlated proportions: McNemar-Bowker test of symmetry. NCSS PASS
https://www.ncss.com/wp-content/themes/ncss/pdf/Procedures/PASS/Tests_for_Multiple_Correlated_Proportions-McNemar-Bowker_Test_of_Symmetry.pdf
Thank you for the post as it help me to implement the test! Just want to point out that on the example you copied the formula of B wrongly (division is not distributive over the sum), but used the right result (:
Hello Juan,
I must be missing something. Can you explain what is wrong with the formula that I used? It seems to be correct.
Charles
Hi Charles,
I agree with Juan. In your definition of B, there is a sum of fractions, but in your example you wrote only one fraction. Correctly you should write B=(15-9)^2/(15+9)+… = 9.7857. In such expression you wrote the result would be 2.0508.
Jirka
Hello Jirka,
Thanks for catching this error. It seems that the calculations were all correct, but I put the wrong formula on the webpage. I have now corrected this error.
I appreciate your help in improving the quality and accuracy of the Real Statistics website.
Charles
Hello Juan,
I got it now. You and Jirka are correct
Thanks for catching this error. It seems that the calculations were all correct, but I put the wrong formula on the webpage. I have now corrected this error.
I appreciate your help in improving the quality and accuracy of the Real Statistics website.
Charles