Objective
McNemar’s Test is a paired sample non-parametric test used when the dependent variable is dichotomous. Often, it is used to determine whether there is a significant change in nominal data before and after an event. We begin with an example.
Example
Example 1: In the BBC program The Doha Debates, 100 people were surveyed regarding their opinion about capital punishment. 30 were in favor and 70 were against. They then listened to a debate about the subject and the survey was repeated. This time 35 voted in favor and 65 against. 11 changed their minds from against to in favor and 6 changed their minds from in favor to against. Did the debate affect people’s opinions?
Let A = number of people who switched from in favor to against = 6
Let B = number of people who switched from against to in favor = 11
If the null hypothesis that the debate had no effect were true, then A = B. It turns out that the test statistic has a chi-square distribution with 1 degree of freedom.
![]()
Since p-value = CHISQ.DIST.RT(1.470588,1) = .225 > .05 = α, we can’t reject the null hypothesis, and so we conclude that the debate did not have a significant effect on the outcome.
Since x ∼ N(0, 1) is equivalent to x2 ∼ χ2(1), we could alternatively use the test statistic
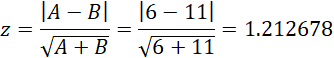
We get the same test result since p-value = 2*(1-NORM.S.DIST(1.212678,TRUE)) = .225.
These results are illustrated in Figure 1.
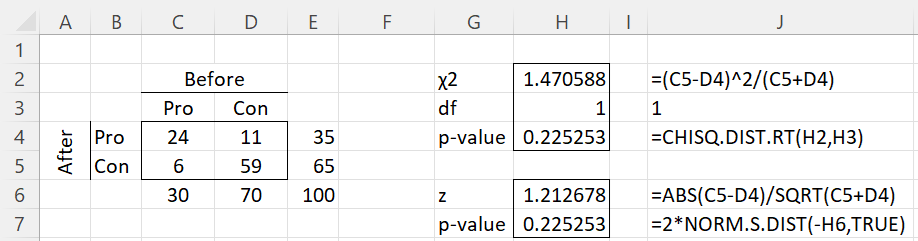
Figure 1 – McNemar’s Test
Note that the values in cells C4 and D5 are not used in the analysis.
One-tailed tests
The above analysis employed two-tailed tests. If we were sure of the direction of the effect, we could use a one-tailed test, where the p-value is half of the value listed above. E.g. p-value = 1-NORM.S.DIST(1.212678,TRUE) = .1126.
Continuity correction
We can also elect to use a continuity correction of one, as follows
![]()
Since p-value = CHISQ.DIST.RT(0.941,1) = .332 > .05 = α, we can’t reject the null hypothesis, and so conclude that the debate did not have a significant effect on the outcome. Alternatively
![]()
Again, we get the same test result since p-value = 2*(1-NORM.S.DIST(.970143,TRUE)) = .332.
The type I error for the test without the continuity correction will occasionally be a little greater than α. Thus, the null hypothesis will be rejected a little more often than it should at the α level of significance. Such a test is called liberal. The continuity-corrected version of the test is conservative, namely, the null hypothesis is rejected a little less often than it should (i.e. it has less power). Usually, the results will be similar.
Restriction
If A + B < 10 (some say A + B < 20 as in Example 1), then McNemar’s test shouldn’t be used. Instead, a two-tailed binomial test of the smaller of A and B should be performed with p = .5 and n = A + B. In the case of Example 1, twice the probability of getting 6 or fewer successes out of 17 is given by
2*BINOM.DIST(6,17,.5,TRUE) = 0.332 > .05 = α
Once again, we cannot reject the null hypothesis, and so conclude the debate did not significantly affect the outcome. The binomial test is equivalent to the sign test.
Non-before/after example
McNemar can be used for any paired sample study with dichotomous data, not just before and after studies.
Example 2: 1,000 heterosexual couples were surveyed about their opinions regarding criminal reform. 705 of the husbands were in favor and 295 against the proposition, while 663 of the wives voted in favor and 337 against it. In 73 of the couples, the husband was in favor, but the wife was against it. In 115, the wife was in favor, but the husband was against it. Was there a significant difference between husbands and their wives about this reform?
In Figure 2, we use McNemar’s Test, including a continuity correction, with A = 115 and B = 73. This time, we observe a significant difference (p-value = .00279 < .05 = α).

Figure 2 – McNemar’s Test
Observations
McNemar’s test is equivalent to a paired samples test where the dependent variable is dichotomous. Ideally, the sample should be selected randomly, and the two groups determined by the dependent variable must be mutually exclusive (i.e. in our example, no one can vote both yes and no, before or after the debate).
Cochran’s Q test is the extension of McNemar’s test for two or more samples (groups). See Cochran’s Q Test for more information, as well as for Real Statistics functions and a data analysis tool that can also be used to support McNemar’s Test.
On this webpage, we have used McNemar’s test for 2 × 2 contingency tables. The test can also be applied to larger tables, as described in McNemar-Bowker Test.
Click here for information about how to calculate the effect size, statistical power, and sample size required for McNemar’s test.
Examples Workbook
Click here to download the Excel workbook with the examples described on this webpage.
Links
References
Wikipedia (2012) McNemar’s test
https://en.wikipedia.org/wiki/McNemar%27s_test
Zar. J. H. (2010) Biostatistical analysis 5th Ed. Pearson
Hi Charles,
I appreciate the article. it’s very clear. I have one question.
We want to test the difference of ‘interest about product’ before and after sharing price information with clients. The sample is paired (we ask questions for same people). But the variable ‘interest’ has three response : “Interested”, “Not interested”, “Indifference”.
I know that we can’t use Mcnemar test, but what type of test is appropriate in this situation ?
Thanks you in advance for your answer.
Hi Rod,
You can use an extended version of McNemar’s test. This is covered in Zar’s book (see new reference on this webpage).
Charles
Rod,
I just realized that support for this type of test is already covered on the Real Statistics website. See
McNemar-Bowker Test
Charles
Hi Charles,
Thank you for this tutorial – it’s helped me greatly as it’s been difficult to find a guide on using the binom.dist function in a matched before/after scenario.
A few questions though, if I am only concerned with the effect in one direction – whether a treatment had an impact, should I move forward with the one-tailed test?
And then, if my data looks like the below (very small sample size with very few changes), is this still an appropriate test to use and did I set up correctly?
Yes-No: 0
No-Yes: 1
Out of a total 11 respondents
=BINOM.DIST(0, 1, .5, TRUE) = .5 > .05
I can thus conclude that the treatment did not significantly affect the outcome, that these changes could be random rather than a result of the treatment?
Thank you so much for any guidance you may provide!
Sarah,
Are you saying that the size of your sample is 1? If so, you can’t expect much from any of the statistical tests.
Your calculation using the BINOM.DIST function is correct and your interpretation is technically correct. Note, however, that with only one element in the sample, you just don’t have enough evidence to conclude whether or not the treatment is effective.
Charles
Can I use McNemars test to compare the effect of two different surfaces on a fingerprint detection technique ? In this setup, i’m comparing left and right side of the fingerprint, specifically the development type A or B. Eg. Left side of fingerprint is A and the right side is B Sample 1: A/B
Sample 2: A/A
Sample 3: A/A
…
Sample N: A/B
My hypothesis is there is no effect of the surface treatment – in reality the left side is “control” /untreated, and the right side is the “test” surface (treated surface). Thus, the development type is unaffected if the hypothesis is true.
Please help! thanks in advance
Sorry, Natalia, but I don’t understand the scenario that you are describing sufficiently well to provide an answer.
Charles
Greetings Dr. Zaiontz,
may I ask if the McNemar’s Test would be a suitable non-parametric static to apply when comparing contiguous binary quadrat data before and after an event? A site has three transects divided into 10 x 5m2 quadrats – totalling 30 quadrats per site. Though a range of data is collected about deer impact within each quadrat (measured and ocular assessments), in the first instance I’m after a simple confirmation that there is a significant statistical difference between the quadrat data before deer control was undertaken and after deer control was implemented. Each of the quadrat data to be represented in a binary form of deer impact (disturbance) either present or absent? Any comment about the McNemar Test or a preferred alternative would be appreciated.
David
Greetings Dr Zaiontz,
thank you for the response – very much appreciated. In my question I referenced the three transects for context as the three transects contain 10 quadrats each. The three transects were randomly located along a peatland community which is being monitored for impacts by deer. The transects were set up to be a sample of a peatland site, as there are other sites in the landscape where three sets of transects have been established. So there’s no plan to compare transects within each site, but there are plans to compare sites to identify a range of impacts of deer across the landscape, and in this instance, to determine whether there is a statistical difference between identifiable impacts upon the peatland before and after a deer control effort. As there are other vegetation parameters being measured, the survey was designed for contiguous plots along a transect. In this environment, peatlands tend to be linear (along soaks and creeklines), so linear transects capture representative peatland communities but also intercept deer movement if they cross or walk along this vegetation type. If there weren’t other parameters being measured, then I’d anticipate that the quadrats could have been randomly scattered or spread at wider intervals along or over the targeted peatlands (but arguably other designs would have been used).
I put some more context in this response to see if the McNemar Test is still applicable and the conditions of the test are met. I also accept that there may be other variables to account for any statistical difference and there is caution on what is interpreted. Multivariate analysis will be used to bring in other variables not discussed in this question. The suggestion for the McNemar Test was for a first up assessment upon one of the elements being monitored in this citizen science project.
Any further confirmation or suggestion about the NcNemar Test would be appreciated.
Best regards,
David
Hello David,
I don’t know whether McNemar is your best choice, but if you have one sample with dichotomous data (e.g. 0 or 1) and want to determine whether there is a significant change before and after an event, then MvNemar’s test can be used.
Charles
1. What is the difference between McNemar’s Test to Phi Coefficient?
2. What is the difference between McNemar’s Test to Cramer’s V Test?
The phi coefficient and Cramer’s V are not tests, they are measures of effect size. See
https://www.real-statistics.com/chi-square-and-f-distributions/effect-size-chi-square/
Charles
Hi Dr. Zaiontz,
Would a McNemar’s test be correct in this situation? Or should I use the Wilcoxon Signed Rank test?
-It is a quality improvement project for asthma patients.
-A group of 4 providers practice of giving asthma action plans (AAP)was looked at before and after receiving an asthma education presentation.
-The providers were all lumped together and the data was collected as 0 = didn’t give an AAP or 1 = did give an AAP
– The implementation period during which encounters were examined was 4 weeks.
– 91 asthma patients were seen during the post asthma education, 77 of which received an AAP
– Retrospectively the first 91 asthma patients were chosen as (pre-implementation controls) only 5 received an action plan.
– I am using them as time 1 and time 2 or (pre-implementation vs post-implementation).
– I was going to use wilcoxon signed rank test because the data is nominal and not continuous so I can’t use a paired t-test. However, then I read about McNemar’s and it seems like this would be appropriate as it is a dichotomous variable.
Any insight is greatly appreciated.
Thanks,
Josh
Josh,
What hypothesis are you trying to test?
Charles
Hi Charles. All of the McNemar test examples I am saw are about a before and after scenario. Is it possible to use McNemar when I’m doing a product test where I ask the same set of respondents to try both Products A and B, and check whether they like one, both, or none? Or am I wrong to treat this as a matched sample? Thanks!
Simon,
You could use McNemar’s Test for any 2 x 2 contingency table. For your situation, one factor is product (A or B) and the other factor is evaluation (like or don’t like). The outcome for each subject is one tick in one of the four boxes. These ticks are added up for all the subjects and then the resulting contingency table is analyzed. This approach, however, doesn’t allow a subject to analyze both products.
Charles
Thanks Charles!
hi, I conducted a consumer survey of two samples (i.e A and B) with 100 respondents, then I want to know which samples they preferred? if this is a related data? how to apply the McNemar Test on this?
Say, 40 of the respondents preferred the sample A and 60 respondents preferred sample B.
Hi JA,
Since 60 > 40, clearly more people in the sample preferred sample B. It’s that simple. No statistical analysis is necessary. Statistics is used to address the issue as to whether this conclusion can be generalized to the whole population (from which the sample is taken). In this case, you could use a test based on the binomial distribution. I don’t see how McNemar’s Test could be used, although perhaps I am missing something.
Charles
hi Charles,
Thanks for this info.
but
Yeah, the 100 respondents (selected) were came from population.
this is a food evaluation study in preference test (which they prefer, sample A or sample B?). So if the panelist tasted both samples at one at a time, this is consider related data, right?
Hence, Binomial test or Chi-square is inappropriate to use, since these tests for unrelated samples or independent sample.
If I understand correctly, each person tastes both A and B and 40 of the people prefer A and 60 prefer B.
Which test to use depends on what hypothesis you want to test. If you want to test whether there is a significant difference between people in the general population’s preference for B over A, then you can use a test based on the binomial distribution. McNemar’s test is not appropriate.
Charles
Hello Charles,
A data stream scenario where we check with a test statistic say with mean, of 100 items and the samples taken from t=1 to t=100 is different from t=901 to t=1000 would a McNemar test be appropriate in this scenario? If not which other test can we use.
Ranji,
What hypothesis are you trying to test?
Charles
Hello,
Can the McNemar’s test be used when there are two dependent groups?
for example, initial data is collected on group A before an intervention is implemented, and post data is collected on group B in 4 weeks after the intervention. this is because most individuals in group A might have discharged from the hospital.
if the McNemar’s test is not appropriate, which analysis test can we use in this situation
thanks
Stacy,
Is this equivalent to saying that group A is the Control group and group B is the Treatment group? If your null hypothesis is that value of some measurement (e.g. number of antibodies) is the same between the groups, then you might be able to use a t-test.
Charles
Dear Charles,
The right-tailed Chi-squared test is equivalent to the two-tailed binomial test.
And it really makes sense to use here the two-tailed test. (unless you have any preliminary direction assumption)
So I assume it is better to use the two tailed test and to duplicate the p-value:
2*BINOMDIST(6,.5,17,TRUE) = 2 * 0.166= 0.332.
Best regards,
Oren
Hello Oren,
Yes, you are correct. I have now corrected this on the website.
Thank you very much for catching this error and helping to make the website more accurate.
Charles
My pleasure dear Charles 🙂
Is this a 1 tailed or 2 tailed test?
I hope this is a 2-tailed test. Then we need to take half of the chi-square critical value.
Is it right?
Please explain.
If it is a 2-tailed test, what would the one-tailed null hypothesis be?
In fact, the test is based on the right tail of the chi-square distribution (one-tailed).
Charles
Thank you very much.
I follow your Excel websites with much interest. You make things so easy to follow with your well-tailored, user-friendly website.
Keep up the great work!
Dr Zaionits, good evening, thank you very much for offering us your knowledge in such a didactic way, Dr. I have a respectful observation in example 2, you estimate the critical value of Chi with the function Chisq_inv_Rt, and not with the function that appears there, respectfully I suggest correction. Additionally, the CHI_DIST_RT function could be used to calculate the p value.
Thank you
Dr Zaionits, buenas noches, muchas gracias por ofrecernos en forma tan didáctica sus conocimientos, Dr. tengo una respetuosa observación en el ejemplo 2, el valor critico de Chi lo estimas con la función Chisq_inv_Rt, y no con la función que aparece allí, respetuosamente sugiero la corrección.
Dear Charles,
Many thanks for a very useful website. I have a question about which statistical test to use for the following scenario.
I have categorical data that are paired. The data asked each participant to write two sentences. The instructions for the first sentence asked each participant to write the sentence with a HIGH level of politeness. The instructions for the second sentence asked each participant to write the sentence with a LOW level of politeness. I then coded their sentences into 9 mutually exclusive categories. I believe the following contingency table can be produced and each cell is the frequency with which the category occurs. For simplicity, I have named the categories A-I and they are nominal categories. There were a total of 164 participants.
High Low
A 63 96
B 2 3
C 0 0
D 4 9
E 15 12
F 0 4
G 0 0
H 34 20
I 46 20
Total 164 164
My aim is to find out whether the frequencies from the HIGH sentences are significantly different from the LOW sentences. Actually, the most helpful would be to determine which categories (A-I) are significantly different. For instance, just from looking at the frequencies, it appears A, H, and I are significantly different when moving from HIGH to LOW, but I’m looking to establish whether these categories are statistically different.
Is there any test that would achieve these aims?
A second question: is there any test that would achieve these aims IF the categories A-I were NOT mutually exclusive (i.e. the total frequency for HIGH and LOW columns are not equal. Thus, a participant could write sentence that included more than one category in the HIGH or LOW columns, e.g. one participant’s sentence could be coded as B AND C)
Many thanks for your help.
Hello Kelvin,
Generally, you would use the chi-square test for independence for these sorts of problems. Simce you have some cells with low values you might need to combine some categories or use the Fisher Exact test. Note that categories C and G are empty and so can be eliminated, leaving you with 7 categories. Categories B and F (and to a lesser extent D) have low values and so could be excluded from the analysis or their values could be combined into one category.
Regarding seeing whether any one category has a significant difference, you could use a binomial test.
I am not sure how to deal with your second question.
Charles
Hi Charles,
Sir,
Where is the McNemar test located in the Real Statistics menu in excel add on?
Hi Prashant,
McNemar’s Test is a special case of Cochran’s Q Test. You can find this test in the Cochran’s Q Test option on the Non-parametric Tests data analysis tool in the Misc tab). See the following webpage for details:
https://real-statistics.com/anova-repeated-measures/cochrans-q-test/real-statistics-cochrans-q-test/
Charles
Sir Can you please give me a data that are using Test for symmetry, test for association, McNemar’s test through SPSS, R and Excel.
Elsa,
All the data that is used on the Real Statistics website can be downloaded for free at
https://real-statistics.com/free-download/real-statistics-examples-workbook/
Charles
Sir Charles. What is Bowker’s test? and how it used?
Kent,
I don-t yet support this test, but I plan to add this support shortly, probably in the next release. You can find more information about this test at
https://ncss-wpengine.netdna-ssl.com/wp-content/themes/ncss/pdf/Procedures/PASS/Tests_for_Multiple_Correlated_Proportions-McNemar-Bowker_Test_of_Symmetry.pdf
Charles
1. There is not any maximum, because it is possible to use even several strategies in one session.
2. Bill used five strategies (i.e., A, C, D, E, F). Sorry if I made a mistake.
3. What determines which strategy used? It is according to subjects’ reports.
4. I am speaking about this field of study (The following article is just an example of articles in this field and is not related to my question):
Souza, A. S., & Oberauer, K. (2018). Does Articulatory Rehearsal Help Immediate Serial Recall?
Carl,
Sorry, but I still don’t understand the situation well enough to offer any advice.
Charles
Thanks for reply. Yes the same test performed for all 20 sessions. Scores or the mean scores are not important for me (but it was from 0 to 10). Imagine the null hypothesis something like this:
Null hypothesis: there is not any difference between two subjects in frequency of performed strategies. Or both subjects used equal number of strategies.
Subject……………….strategy in sessions…………….…… frequency of used strategies
John…………….A…A…A…A…B…B…B…B…B…B………………………… 2
Bill……………….A…A…A…A…C…C…C…D…E…F………………………… 5
Carl,
I am now confused. Based on your previous comment, John always uses 2 strategies and Bill always uses 4 strategies (although your example shows 5 strategies). What determines which strategy John and Bill use at each session. Is it random? What is the maximum number of strategies?
Charles
Hi Charles,
Could you please help me for choosing a test for my data.
Two subjects performed a task for 10 sessions in ten consecutive days. The first one used two strategies for all ten sessions (for example three sessions by using strategy 1 and seven sessions by strategy 2), but the second one performed 4 different strategies during 10 sessions.
Which test I should use to show that there is (or not) a difference in frequency of using different types of strategies between them?
Thanks.
Hi Charles,
Could you please help me for choosing a test for my data. Two subjects performed a task for 10 sessions in ten consecutive days. The first one used two strategies for all ten sessions (for example three sessions by strategy A and seven sessions by strategy B), but the second one performed 5 different strategies during 10 sessions. Which test I should use to determine is there any difference between them or not?
Hi Carl,
How is the performance of these tasks evaluated? E.g. a value from 0 to 100? Is it the same task that is performed for all 20 sessions?
Suppose your two subjects are called John and Bill. Are you interested in determining whether the John’s overall score is different from Bill’s score?
Charles
Hi Dr. Zaiontz,
Imagine you are running a cancer clinic. Some people you see will have a symptom (say a lump). When you evaluate some symptoms you find a cancer. Most people you see do not have a symptom and they undergo screening to determine if they have a cancer. Screening can be a mammogram, an ultrasound, or both depending on individual circumstances.
Each cancer has a stage at diagnosis. Stages range from 0 to 4. With higher numbered stage, prognosis is worse, but the stages are not linear. In other words, although a stage 4 cancer is worse than a stage 2 cancer, it is not twice as bad as a stage 2 cancer.
Screening is performed to decrease stage at diagnosis. Most people who you see with a symptom that indicates a cancer are at least stage 2. Screen detected cancers are usually stage 1. Stage 1 is much better. Stage 2 and above are advanced cancers. With screening you usually find cancers in somewhere between 0.4%-1.5% of people screened.
You see about 6,000 people in your clinic. You diagnose about 150 cancers. You have recorded what imaging people had done that resulted in the diagnosis. For each diagnostic study you know if the cancer was seen.
You calculate the proportion of cancers diagnosed that were advanced (stage>1) for each method of diagnosis, symptomatic, mammogram, ultrasound, or mammogram+ultrasound.
You find that the proportion of advanced cancers when compared to the proportion of symptomatic cancers is as follows: mammogram > mammogram+ultrasound. Ultrasound alone is roughly the same as mammogram. This Implies that the combination of mammogram+ultrasound is a better screening strategy.
How would you test this hyopothesis? These are paired observations, so I was thinking of using the McNemar test and running multiple comparisons, i.e. symptomatic vs. mammogram, symptomatic vs. ultrasound, etc., but the multiple comparisons are concerning. I would appreciate any thoughts you might have…. Thank you!
Jason,
I understand that you are trying to test “whether the combination of mammogram+ultrasound is a better screening strategy than ultrasound alone.” Is this correct?
If so, first you need to define what it means to be “a better screening strategy”. Does this mean significantly fewer deaths? or lives longer? or something else? What if you haven’t run the experiment long enough to know which category a person fits into?
Why do you say these are paired observations? A person can’t be both in the category of mammogram+ultrasound and the category of ultrasound only.
Charles
Hi Dr. Zaiontz,
Thanks for your reply. Currently, we see people who come in with a symptom that is due to a cancer. Everybody without a symptom gets a mammogram for screening. Many, but not all, asymptomatic people also get an ultrasound if they have “increased breast density,” a mammographic finding known to decrease the sensitivity of mammography.
Therefore, some people have a cancer detected because they have a symptom. Of the people with cancer who don’t have a symptom, some are detected on mammogram, some on ultrasound alone, and some on both studies. We know how each cancer we have found was detected. We know what stage at diagnosis each cancer was.
So based on this data, we can hypothesize three strategies: wait for the symptomatic cancer (no screening), screen asymptomatic people with a mammogram, and screen asymptomatic people with a mammogram+ultrasound.
Of people with cancer who have a symptom, x percent would have an advanced cancer. If we were seeing people with symptomatic cancers, but also screening asymptomatic people with mammography alone, y percent would have advanced cancers. And if we were seeing people with symptomatic cancers, but also screening asymptomatic people with both mammography and ultrasound, we would have z percent would have advanced cancers. We hypothesize that x>y>z. The best screening strategy is the strategy that has the lowest percentage of advanced cancers. The question is, how would we test this hypothesis.
Thank you, we appreciate your help… Jason
Jason,
Let me makes sure that I understand what x, y and z are. Are you saying that the data shows that (1) x% of patients with a symptom have advanced cancer, (2) y% of patients with a symptom or who are screened with mammogram only have advanced cancer and (3) z% of patients with a symptom or who are screened with both mammogram and ultrasound have advanced cancer? In (2) I assume that you are including patents who are screened even if the mammogram is negative, is that correct? (and similarly for (3)). What about patients who are screened and show signs of cancer but not advanced cancer?
I am not sure why you are including patients with a symptom in all three categories. Why not keep things simple and compare (1) x% of patients with a symptom have advanced cancer, (2) y% of asymptomatic patients who are screened with a mammogram only have advanced cancer and (3) z% of asymptomatic patients who are screened with both mammogram and ultrasound have advanced cancer
Hi Dr. Zaiontz,
We thought about just comparing the screening patients and excluding the symptomatic patients, but we decided to include them because we want to perform an “intent to treat” analysis. No method of screening is perfect and there will always be people who come in with symptomatic cancers. Some because they are missed on screening and some who just don’t get screened. We want to be conservative and not overstate the benefits of screening.
We envisioned the denominator for x,y,and z as being the total number of cancers diagnosed in each category, not the number of people screened. For example, y represents the percentage of advanced cancers diagnosed out of all the cancers you would diagnose if you were seeing symptomatic cancers and doing screening with mammogram alone on asymptomatic cancers.
We appreciate your help with this… Jason
Jason,
The problem with this approach, from the point of view of the statistical analysis, is that the set of patients in the three groups that yield the x, y and z percentages overlap. If I call these three groups X, Y and Z, then if I remember correctly X is a subset of Y and Y is a subset of Z. Thus we don’t have independence when we compare these groups. If instead I don’t include the members in X in Y and I don’t include the members in X or Y in Z, then I can use all the usual statistical analyses. If these groups have significantly different means, then although I can’t automatically conclude that the groups with overlap have significantly different means, probably I can make such assertions in many real-world situations.
These are some of my initial thoughts (off the top of my head).
Charles
Sir i am not able to use Mc Nemars test from your software \please guide
Puneet,
The test is called the Cochran’s Q Test in the software and can be found as one of the options of the Non-parametric Test data analysis tool.
Charles
This is very close to what I need; however, my null-hypothesis is that the results are different. In your examples this would correspond to opinions changing; therefore, rejecting the null hypothesis would amount to statistically concluding that the opinions didn’t change (contrary to expectation).
What test should be used for this opposite null hypothesis with binary ‘yes’ or ‘no’ type data?
Dane,
You should be able to use the usual test, but a significant result result would support the alternative hypothesis. You should also look at the power of the test.
Charles
Dear Charles,
I also am struggling to decide what the best statistical test would be for my data. I have a set of students who listened to my lecture. I did a pre-test and post-test multiple and true-false questions. I asked the same questions before and after the lecture. I recorded Correct answers with 0 and Incorrect answers with 1. I want to see whether my lecture had an impact on their understanding. Each student answered the pre- and the post-test questions.
Diana,
One approach is to assign a score to each questionnaire (based on all the questions asked). Then perform a paired t test.
Charles
Thank you so much!
Dr Pity please excuse me that Excel is likely taking to the contrary, please excuse me error
CHISQ_INV 3.841458821 = (0.95, 1)
Dr Hello, I wish you a Merry Christmas and a lot of prosperity for the coming times. Dr’m very grateful to their shared knowledge and your page is like carrying the R software Excel, and put it in simple and understandable terms. Dr in Example 1 McNemar think is a mistake because CHIINV (05, 1) = 0.0039 making significant changes of opinion arise. Please if I am wrong correct me.
Thank you.
Dear Charles,
I am struggling to decide what the best statistical test would be for my data. I have a set of patients who have all had two imaging tests – computed tomography (CT) and MRI. The data from CT is ordinal as I have completed a radiological score (1 to 4). The data from MRI is categorical – present vs. not present. I would like to test the null hypothesis there is no relationship between CT scores and MRI presence/non-presence.
I have concluded that data must be paired as it is from the same patient and both CT and MRI were completed at the same time. I think a McNemar’s should be suitable but with four possible CT scores would Cochran’s Q test be better?
I am really grateful for your help.
Cochran’s Q test requires that all the data be dichotomous. In your example this is not the case since you use scores of 1, 2, 3, 4.
It seems to me that the appropriate way to look at the problem as a two sample t test. Sample 1 consists of all the CT values where the corresponding MRI value is present and sample 2 consists of all the CT values where the corresponding MRI value is not present. Since it is likely that the normality assumption for the t test is not met, you probably need to use the Mann-Whitney test instead.
Charles
Hi Charles,
I’m now start learning non-parametric test from your website:)
One thing confused me is “the test statistic A – B has chi-square distribution with 1 degree of freedom.” , why is “one degree of freedom”?
Do appreciated if you give some hints:)
Wen
Wen,
Although I don’t have a precise answer for you, I have two hints:
1. It is probably related to the fact that if x has a standard normal distribution then x^2 has a chi-square distribution with 1 degree of freedom and for large enough samples the binomial distribution can be approximated by the normal distribution.
2. McNemar’s test is a simple form of Cochran’s test
Charles
Could you clarify this for me please? You say that if A + B < 25, then you should use the binomial distribution to calculate the p-value. However, in Example 2, A + B is larger than 25 (i.e., 117 + 73) but you still use the binomial distribution. Should this be the chi-sq distribution? I understand that the resulting p-values will be very similar in this case, but was wondering if I missed something. Thanks.
Andy,
In Example 2, I showed both the McNemar test (based on chi-square) as well as the binomial test. Since A + B >= 25, you should use the McNemar test and ignore the binomial test.
Charles
How were a and b calculated?
A and B are not calculated. They are measured (i.e. they are the input values). Note that in Example 1 B-A = 11-6 = 5 which is the difference between the number voting in favor before and after, i.e 35-30 = 5.
Charles