Worksheet Functions
Real Statistics Functions: The Real Statistics Resource Pack provides the following functions:
COCHRAN(R1, raw, cont) = Cochran’s Q statistic
QTEST(R1, raw, cont) = p-value for Cochran’s Q test
QRATIO(R1, raw) – an array function that returns a row range with the percentages of each independent variable for Cochran’s Q test
Two data input formats are supported: raw data (raw = TRUE) and summarized data (raw = FALSE, default), i.e. data in the form of a multi-variable frequency table.
If cont = TRUE (default), then a continuity correction of 1 is employed when there are only two variables. This makes Cochran’s Q test equivalent to McNemar’s test when there are two variables.
For Example 1 of Cochran’s Q Test, the formulas
- COCHRAN(B4:D23,TRUE) = 6.705882
- QTEST(B4:D23,TRUE) = 0.034981
- QRATIO(B4:D23,TRUE) produces the output in range L4:N4 of Figure 3 of Cochran’s Q Test.
For Example 1 of Cochran’s Q Test using Summary Data, COCHRAN(A4:E19) = 7.366972, QTEST(A4:E19) = 0.061077, and = QRATIO(A4:E19) produces the output in range M4:P4 of Figure 3 of Cochran’s Q Test using Summary Data.
These functions can also be used with completely blank columns. We can, therefore, calculate Cochran’s Q for the data in Figure 4 of Cochran’s Q Test. In this case, COCHRAN(B51:D70,TRUE,FALSE) = 5.333333 and QTEST(B51:D70,TRUE,FALSE) = 0.020921. These are the results without using a continuity correction. The results using a continuity correction (i.e. for McNemar’s test) are COCHRAN(B51:D70,TRUE) = 4.6785 and QTEST(B51:D70,TRUE) = 0.030383.
Data Analysis Tool
Real Statistics Data Analysis Tool: The Real Statistics Resource Pack provides support for Cochran’s Q Test as part of the Non-parametric Tests data analysis tool.
For example, to produce the output for Example 1 of Cochran’s Q Test using Summary Data, press Ctrl-m and double-click on the Non-parametric Tests option (after first selecting the Misc tab if using the multipage interface). Fill in the dialog box that appears as described in Figure 1.
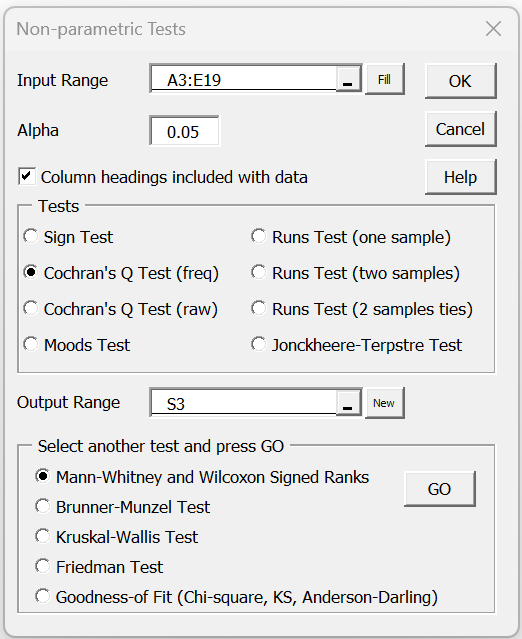
Figure 1 – Non-parametric Tests dialog box
When you click on the OK button, the output shown in Figure 2 is displayed.
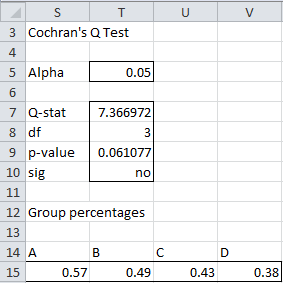
Figure 2 – Cochran’s Q Test output
When there are only two variables, the data analysis tool will apply a continuity correction of 0.5, so the results will be equivalent to those of McNemar’s test.
Links
Examples Workbook
Click here to download the Excel workbook with the examples described on this webpage.
References
Wikipedia (2014) Cochran’s Q
https://en.wikipedia.org/wiki/Cochran%27s_Q_test
NCSS (2014) Cochran’s Q test
https://www.ncss.com/wp-content/themes/ncss/pdf/Procedures/NCSS/Cochrans_Q_Test.pdf
How can I learn this now because I was asked to determine my finite sample size using crocharan statistical tool.
Raphael,
Sorry, but I don’t understand your question. Do you mean Crocharan or Cochran?
Charles
Sorry, I mean Cochran.
Thanks for your clarification, but I don’t understand your question. Can you be more specific?
Charles
What are the modalities for the application of Cochran?
See https://real-statistics.com/anova-repeated-measures/cochrans-q-test/
Charles