The Real Statistics T Tests and Non-parametric Equivalents data analysis tool supports the Mann-Whitney and Wilcoxon Signed-Ranks tests, while the One Factor ANOVA data analysis tool supports the Kruskal-Wallis non-parametric test. We now describe another data analysis tool that provides access to a number of non-parametric tests.
Tool Options
Real Statistics Data Analysis Tool: The Real Statistics Resource Pack provides the Non-parametric Tests data analysis tool which supports the following tests:
- Sign Test
- One-Sample Runs Test
- Two-Sample Runs Test
- Cochran’s Q Test
- Moods’ Median Test
- Mann-Whitney Test
- Wilcoxon Signed-Ranks Test
- Kruskal-Wallis Test
- Goodness-of-Fit tests
These include the two-sample version of the Moods’ Median Test and McNemar’s Test, which is the two-sample version of Cochran’s Q Test.
Example (McNemar’s Test)
We repeat Example 2 of McNemar’s Test using the Non-parametric Tests data analysis tool. In this example, 1,000 people were surveyed, with 705 in favor and 295 against a motion. After they listened to a debate, 73 people changed their vote from against to in favor, and 115 changed their vote from in favor to against. We now test whether the debate affected people’s opinions.
We code the input data as shown in range A3:C8 of Figure 1, where 1 means “in favor of the motion” and 0 means “against the motion”.
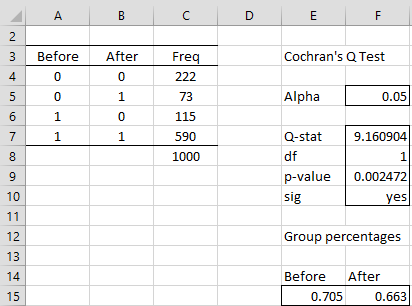
Figure 1 – McNemar’s Test
We perform the test by pressing Ctrl-m and selecting the Non-parametric Tests data analysis tool from the Misc tab (or from the main menu if using the original version of the user interface). This brings up the dialog box for the Non-parametric Tests data analysis tool. Fill in the dialog box as shown in Figure 2.
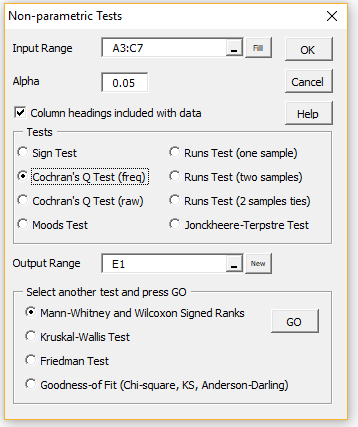
Figure 2 – Non-parametric Tests dialog box
Note that we insert A3:C7 in the Input Range and choose the Cochran’s Q Test (freq) option. Upon clicking on the OK button, the output shown in range E3:F11 of Figure 1 appears.
The output is similar to that shown in Figure 1 of McNemar’s Test. Note that this test includes a .5 continuity correction factor. To get the result of Cochran’s Q Test without using the correction factor, you need to manually change the formula in cell F7 from =COCHRAN(A4:C7) to =COCHRAN(A4:C7,,FALSE), and the values in cells F7 and F9 change to 9.382979 and 0.00219.
The GO button
To access the Mann-Whitney or Wilcoxon Signed Ranks test, simply choose the appropriate option from the dialog box shown in Figure 1 and press the GO button (don’t fill in any other fields). You will then be redirected to the T Test and Non-parametric Equivalents data analysis tool, where you can further describe the test that you want.
Similarly, to access the Kruskal-Wallis test, choose this option and press the GO button without filling in any other fields, and you will be redirected to the Anova: Single Factor data analysis tool to complete the test.
To access the Friedman’s test, choose this option and press the GO button, and you will be redirected to the Friedman Test data analysis tool. Finally, to access any of the goodness-of-fit tests, choose this option and press the GO button, and you will be redirected to the Goodness-of-Fit data analysis tool.
Runs Test
When choosing the Two-Sample Runs Test with Ties option, the number of distinct columns in the output is not completely determined. The software will assume there are 5 columns (plus one column for labels). If this is more than necessary, then any unused columns will be filled with the values #N/A. If 5 isn’t enough, you will need to manually expand the range in the output that contains the array formula of form =RUNS2TEST(R1, R2, TRUE, 100), and press Ctrl-Shft-Enter. See Two-Sample Runs Test for more information about this formula.
Similarly, if you want to use a number of iterations different from 100, you will need to highlight the =RUNS2TEST(R1, R2, TRUE, 100) formula in the formula bar, change the number of iterations, and press Ctrl-Shft-Enter.
Sign Test
For the Sign Test, if the data in the Input Range contains exactly two columns, then the paired-sample sign test is performed, while if it contains any other number of columns, then the one-sample sign test is performed. For Example 1 of Paired Samples Sign Test, if B3:C18 is placed in the Input Range of the dialog box of Figure 1, then the output will be as shown on the right side of Figure 1 of Paired Samples Sign Test. We obtain the same output if we insert the range D3:D18 in the Input Range.
Examples Workbook
Click here to download the Excel workbook with the examples described on this webpage.
Links
References
Zar. J. H. (2010) Biostatistical analysis 5th Ed. Pearson
Stricker, D. (2016) Brightstat nonparametric tests
https://secure.brightstat.com/index.php?p=c&d=1&c=2
Howell, D. C. (2010) Statistical methods for psychology (7th ed.). Wadsworth, Cengage Learning.
https://labs.la.utexas.edu/gilden/files/2016/05/Statistics-Text.pdf
Hi, Charles.
I want to conduct a Fisher Exact Test on a 2×12 table. Internet only supports up to and including a 2×4.
Thanks.
Regards,
Roland
Hello Roland,
The Real Statistics software supports Fisher’s Exact Test for the following sized contingency tables:
2 × 2, 2 × 3, 2 × 4, 2 × 5, 2 × 6, 2 × 7, 2 × 8, 2 × 9, 3 × 3, 3 × 4 or 3 × 5
See the following webpage for details.
https://www.real-statistics.com/chi-square-and-f-distributions/fishers-exact-test/
Charles
Hello Charles,
I want to thank you for your very useful website and software! This have made my thesis writing so much easier.
My data are not normal distributed, so I performed the Mann-Whitney Test of my samples. I have two questions:
1) I am wondering if this is the only step I need to do to know if my groups are significantly different, or are there some test I should do before or after this test?
2) I have three different groups, (not dependent). With 20 samples each, and I want to check if they are significant different from each other.
I tried doing the test by comparing two groups against each other. And then taking the other two groups and compare them against each other.
My problem is that I am not sure which number/p-value to look at to know if they are different. Is it p-exact in the two tailed that would be correct for this purpose or am I doing the wrong test for my samples?
Adding the tresults from the tes that i did:
————————————————————-
Saccharina Artificial
count 20 20
median 1 2,5
rank sum 335 485
U 275 125
one tail two tail
U 125
mean 200
std dev 36,96845502
z-score 2,015231633 yates
effect r 0,318636099
p-norm 0,021940192 0,043880384
p-exact 0,021492316 0,042984633
p-simul 0,0078 0,0151
———————————————————
Saccharina Laminaria
count 20 20
median 1 1
rank sum 87,5 432,5
U 222,5 17,5
one tail two tail
U 177, 5
mean 200
std dev 36,96845502
z-score 0,608627003
effect r 0,096232379
p-norm 0,271385851 0,542771702
p-exact 0,273411509 0,546823018
p-simul 0,201 0,4115
———————————————————–
Artificial Laminaria
count 20 20
median 2,5 1
rank sum 460 360
U 150 250
one tail two tail
U 150
mean 200
std dev 36,96845502
z-score 1,338979407 yates
effect r 0,211711233
p-norm 0,090288688 0,180577377
p-exact 0,091315419 0,182630839
p-simul 0,0748 0,1505
———————————————————–
I would like to add that I have the possibility to increase my sample amount up to n=60 instead of n=20. Bu I would prefer to only use n=20.
Many thanks for you help!
Best regards,
Sunniva
Hello Sunniva,
(1) Based on the limited info I have, it seems like you only need to perform the Mann-Whitney test, assuming that you have two independent samples.
(2) If you have three groups, then you shouldn’t use the Mann-Whitney test. Instead, you should use the Kruskal-Wallis test and one of the follow-up tests if you have a significant result, as described at
https://www.real-statistics.com/kruskal-wallis-test/
If the homogeneity of variances assumptions fails, then you should consider using Welch’s ANOVA as described at
https://www.real-statistics.com/one-way-analysis-of-variance-anova/welchs-procedure/
Charles
Good evening sir. Do you have any reference regarding Moses Extreme Reaction Test? I am currently working on that formula. All I can see is Mann-Whitney U. I hope you could help me with this. Thank you.
Hello Mark,
See https://spu.fem.uniag.sk/cvicenia/ksov/prokeinova/Business%20Statistics%20and%20Econometrics/Literature/20089702653110.pdf
Charles
Dear Sir, I am a medical doctor conducting an operational research on assessing the inter-observer variation of 2 chest x-ray (CXR) readers. This is was an easy task as the reading and its data met all 5 assumptions to conduct the analysis using Cohen kappa (k). Now, I had a question/problem regarding what analysis to do in comparing the CXR readings of the 2 observers who read the discordant results (disease present or not present) together and reached to a consensus on each discordant CXR reading. I wanted to compare their first reading (done separately) against their consensus reading (done together) which hampered my intention to compare their first reading with this consensus reading for each reader as an “intra-observer” variation/agreement. I feared that it does not meet some of the assumptions to conduct this analysis using ICC (Intra-Class Classification). Can I use Fleiss’ kappa analysis (non-parametric) for this? or what do you recommend?
Could you please send me your response using my email address (alfaeli@yahoo.com)?
This is an interesting question. I assume that this time you have three raters: A, B and a consensus of A&B. This seems to violate all the interrater measurements that I am familiar with. One question that I have is, “how is the consensus between A&B reached”?
Charles
Hi Dr. Charles;
Good times,
I ask, If you could help me to find a specific information about maximal information coefficient (MIC), and it’s values and the significant (p-value), also how to Interpret it’s values.
My best regards;
Amer
Amer,
Sorry, but Real Statistics doesn’t support MIC. There is a lot of info on the internet about MIC, including
https://en.wikipedia.org/wiki/Maximal_information_coefficient
Charles
Hi is this toolpack available in excel? How to ?
Sam,
You must download the free Excel addin, by going to the following webpage:
Free Download
Charles
hey i want to check significance difference between reflectance values of 4 different rock types at different positions with the wavelengths. which test can i conduct on my data.
I am afraid that I need more information in order to answer your question. It is likely that some version of ANOVA would be appropriate.
Charles
Hello!
Thank you for your website. I want to perform a friedman test in excel but it seems a tool is needed to be installed first. I have excel 2016. Can you please help me to find this tool?
Elias,
After installing the Real Statistics Resource Pack, you can use the Non-parametric Tests data analysis tool.
Charles
Hi,
Thank you very much for the available information. It is so helpful.
I got some issues with my research. My data is a paired dependent sample means I analyze the difference of the variable before and after implementation of a particular condition. However, this variable is an ordinal data. I rank the data from level 1 to level 10. I would like to analyze whether after the implementation the variable decreased or not. For example stress level before and after.
How I use data analysis package in excel for analyzing this variable? I checked for paired sample, there is only a paired t-test tool which is used for ratio data. I think I can’t use this tool for analyzing the condition of mentioned variable, is that right? If so, Can you recommend me how to analyze this particular data using excel?
Thank you very much. I hope you can help me.
If you believe that the rankings are evenly spaced; e.g. 5 is the same units above 1 as 10 is above 6, then you can assume that the data is interval data and so can use a paired t test (provided the other assumptions are met).
Charles
Please I need guide how to run a Data base on Statistical and Trend Analysis of Rainfall by Using non Parametric
Nass, Sorry but I don’t understand your question.
Charles
Hi,
So happy I found this page!! I am also conducting a survey study with Likert scale, my problem is:
1.) when I have made a regression calculation in SPSS, I have read one should pay attention to the statistical significans..however, I do not have any hypothesis. My research Q’s are formed to investigate the impact of one factor on another. Should I ignore tha stat significance then?
2.) I have both symmetrical and skewed data, how do I handle this? I am assuming that I can use these variables in a correlation?
3) Just to be clear, every factor in the questionnaire is one variable?
Many Thanks for your help!!
Kr’s
Hana,
1. Statistical significance in regression tests whether the regression model (or some part of the model such as a coefficient) fits the data. If the model is not a good fit, then any conclusion you make won’t be worth much.
2. It really depends on what you are trying to as to whether or not it is necessary to have data which is symmetric. In any case, when symmetry or normality is required, often you can transform the data to meet the assumption or use some other test which doesn’t require this assumption (e.g. a non-parametric test).
3. Not necessarily, although you can certainly view each question as representing one variable.
Charles
Sir Thank you very much for information on your website.
I am doing questionnaire survey with 5-point likert scale on 22 factors and my sample size is very small like 10 respondents from 2 diff groups which I want to analyze with statistical method can you please suggest some method i tried doing it with mann whitney u test but p-value is coming too small.
Shweta,
You probably shouldn’t expect too much (esp. regarding statistical power) from such a small sample. But in any case, what do you mean that the p-value is too small?
Charles