Basic Concepts
The two-sample version of the Anderson-Darling test serves the same purpose as the two-sample Kolmogorov-Smirnov test but is more powerful.
Suppose the first sample contains the elements X = {x1, …, xm} and the second sample contains the elements Y = {y1, …, yn}, where each sample is ordered from smallest to largest elements. Now suppose that Z = {z1, …, zk} is the combined sample (where k = m+n), also ordered from smallest to largest elements.
The Anderson-Darling test statistic is
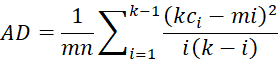
where for any i, 1 ≤ i ≤ k, ci = # of elements in Ci = {x: x ∈ X and x ≤ zi}.
The null hypothesis that X and Y come from the same continuous distribution is rejected if AD ≥ ADcrit, where ADcrit is the critical value found in the table of critical values.
A large sample approximation for ADcrit for any α is given by
(AD∞ – 1)(1 – 1.55/k) + 1
where AD∞ is the critical value at infinity for that value of α. Note too that the AD∞ values are the same as those for the one-sample AD test, and can be calculated using the Real Statistics function AD_INV (with corresponding p-values calculated by AD_DIST). Critical values for relatively small sample sizes m and n can be found in the Two-Sample Anderson-Darling Table.
Example
Example 1: Repeat Example 2 of the Two-sample Kolmogorov-Smirnov Test using the two-sample AD test to determine whether the two samples shown in range B3: C11 of Figure 1 come from the same distribution.
The analysis is shown in Figure 1. Since AD = .74687 < ADcrit = 2.381, we cannot reject the null hypothesis and conclude with 95% confidence that the two samples come from the same distribution.
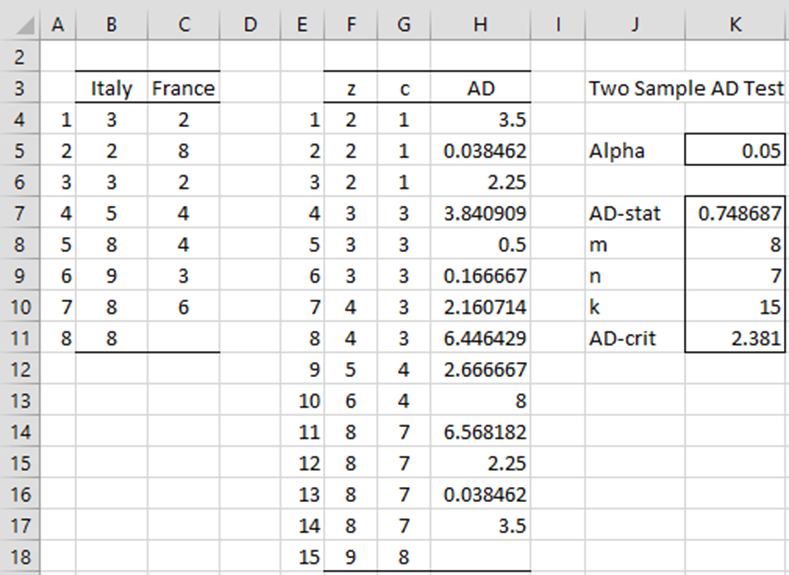
Figure 1 – Two-sample AD test
To conduct the analysis, we insert the formulas =COUNT(B4:B11), =COUNT(C4:C11) and =K8+K9 in cells K8, K9 and K10, respectively. We now create the combined sample by inserting the array formula =QSORT(B4:C11 in range F4:F18. To create the ci value, we insert the formula =COUNTIF($B$4:$B$11,”<=”&F4) in cell G4, highlight the range G4:G18, and press Ctrl-D.
Next, we insert the formula =($E$18*G4-$K$8*E4)^2/(E4*($E$18-E4)) in cell H4, highlight the range H4:H17, and press Ctrl-D to calculate the AD statistic by placing the formula =SUM(H4:H17)/(K8*K9) in cell K7. The critical value in cell K11 comes from the table of critical values in the Two-Sample Anderson-Darling Table.
Handling ties
In the case of ties, the approach described above needs to be modified as follows.
Let z’1 < …< z’r be the unique elements in the combined sample, and define fi = the frequency of z’i in the combined sample, and

![]()
The revised definition of the AD statistic is
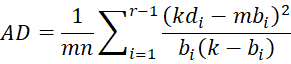
The revised analysis for Example 1 is now shown in Figure 2.
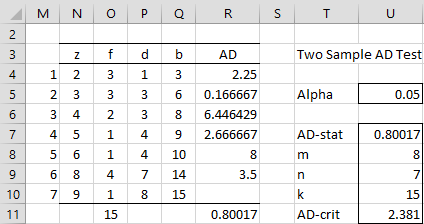
Figure 2 – Two-sample AD test with ties
Range N4:N10 contains either the array formula =NODUPES(B4:C11,,TRUE) or =SortUnique(B4:C11). Cell O4 contains =COUNTIF($B$4:$C$11,N4), cell P4 contains =COUNTIF($B$4:$B$11,”<=”&N4). The other cells in columns O and P are filled in by highlighting the range O4:P10 and pressing Ctrl-D.
Column Q is filled in by inserting the formulas =O4 in Q4 and =Q4+O5 in Q5, and then highlighting range Q5:Q10 and pressing Ctrl-D.
Finally, to calculate AD, we place the formula
=($O$11*P4-$K$8*Q4)^2/(Q4*($O$11-Q4))
in cell R4, highlight range R4:R9 and press Ctrl-D, and then insert the formula =SUMPRODUCT(O4:O9,R4:R9)/(K8*K9) in cell U7.
Worksheet Functions
Real Statistics Functions: The Real Statistics Resource Pack provides the following functions for conducting the two-sample Anderson-Darling test.
AD2TEST(R1, R2, lab, alpha, ties): returns a column array with the AD statistics for a two-sample AD test, a p-value, the critical value, and the sample sizes. If lab = TRUE (default FALSE), an extra column of labels is appended to the output, alpha is the significance level (default .05), and ties = TRUE (default) if a ties correction is applied.
AD2PROB(AD, m, n) = large sample estimate of the p-value for the two-sample AD statistic for samples of size m and n
AD2CRIT(m, n, alpha) = large sample estimate of the critical value for the two-sample Anderson-Darling test for samples of size m and n and the significance level alpha (default .05)
AD2CRITX(m, n, alpha) = critical value for the two-sample Anderson-Darling test for smaller samples of size m and n and the significance level alpha (default .05) based on the table of critical values.
We can use these functions to obtain the solution for Example 1, as shown in Figure 3.
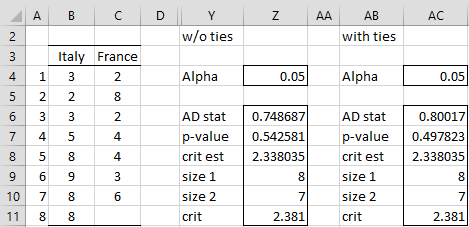
Figure 3 – Real Statistics two-sample AD test
Here, range Y6:Z11 contains the array formula
=AD2TEST(B4:B11,C4:C11,TRUE,Z4,FALSE)
while AB6:AC11 contains the array formula
=AD2TEST(B4:B11,C4:C11,TRUE,AC4).
We can also calculate the value in cell Z7 via =AD2PROB(Z6,Z9,Z10), the value in cell Z8 via =AD2CRIT(Z9,Z10,Z4) and the value in cell Z11 via =AD2CRITX(Z9,Z10,Z4).
Handling frequency tables
We can also use the Anderson-Darling test when the data are arranged in frequency table format.
Example 2: Repeat Example 1 of the Two-sample Kolmogorov-Smirnov Test using a two-sample AD test.
The approach, shown in Figure 4, is similar to that used for Example 1 with ties.
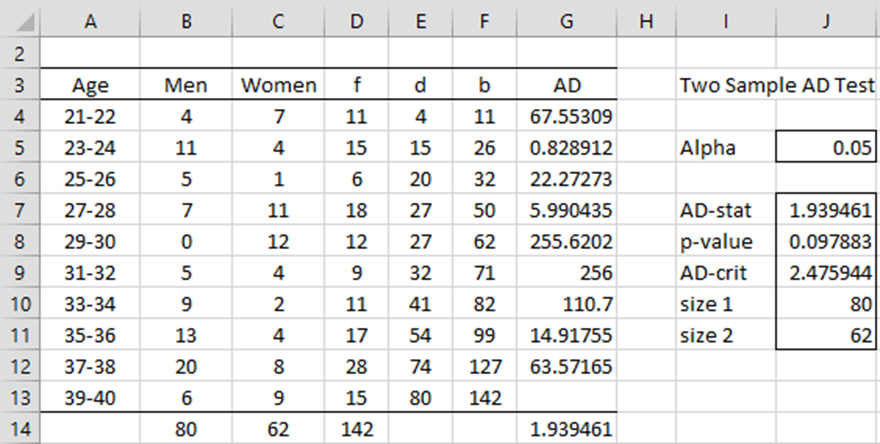
Figure 4 – Two-sample AD test (frequency table)
To construct the figure, insert the formulas =B4+C4, =B4, and =D4 in cells D4, E4 and F4. Next, insert =B5+C5, =B5+E4, and =D5+F4 in cells D5, E5, and F5, and then highlight the range D5:F13 and press Ctrl-D. Insert =SUM(B4:B13), =SUM(C4:C13) and =B14+C14 in cells B14, C14 and D14.
The AD statistic (in cell G14) is calculated by inserting the worksheet formula =($D$14*E4-$J$10*F4)^2/(F4*($D$14-F4)) in cell G4, highlighting range G4:G12 and pressing Ctrl-D, followed by the insertion of the formula =SUMPRODUCT(D4:D12,G4:G12)/(B14*C14) in cell G14.
Cells J8 and J9 are calculated by formulas =AD2PROB(J7,J10,J11) and =AD2CRIT(J10,J11,J5).
Since p-value = .098 > .05 = alpha, we conclude that the two samples come from the same distribution. Note that the result is different from that of the Kolmogorov-Smirnov Test, where p-value = .043 < .05 = alpha.
Worksheet function for frequency tables
Real Statistics Function: The AD2TEST function can take the following form (where R2 is omitted).
AD2TEST(R1, , lab, alpha): returns a column array with the AD statistics for a two-sample AD test, a p-value, the critical value, and the sample sizes based on two columns of data in R1 representing the frequencies of the two samples.
The output in range I7:J11 of Figure 4 can be calculated by the array formula =AD2TEST(B4:C13,,TRUE). Note that although column A is not included in the input range B4:C13, the data in columns B and C must correspond to data in column A that is in ascending order.
Data Analysis Tool
You can also perform the Two-sample Anderson-Darling Test via the Goodness of Fit data analysis tool. Click here for more information about this data analysis tool.
Examples Workbook
Click here to download the Excel workbook with the examples described on this webpage.
Links
References
Pettitt, A. N. (1976) A two-sample Anderson-Darling rank statistic. Biometrika, 63, 161-168.
https://www.semanticscholar.org/paper/A-two-sample-Anderson-Darling-rank-statistic-Pettitt/31a38142b2f78fb54487fa928b04ff4efa517bba
Engmann, S., Cousineau, D. (2011) Comparing distributions: the two-sample Anderson-Darling test as an alternative to the Kolmogorov-Smirnoff test.
http://www.jaqm.ro/issues/volume-6,issue-3/pdfs/1_engmann_cousineau.pdf
Hi Charles,
Is there any way to see the underlying formula that is being used to calculate the critical value? That is, what is the formula that is used when calculating AD2CRIT(m, n, alpha)?
Thank you,
Jadon
Hi Jadon,
I don’t know what was used to create the table of critical values. Usually, it is based on a simulation. E.g. the following webpage describes how this might be done: https://real-statistics.com/one-way-analysis-of-variance-anova/power-tukey-hsd-test/
Charles