Objective
To test whether a set of numbers follows Benford’s law, we can use a number of statistical goodness-of-fit techniques. We briefly review the chi-square, Kolmogorov-Smirnov, and Anderson-Darling approaches. The chi-square approach is the least preferred, and AD is the most.
Chi-square Test
This test employs the approach described in Example 3 of Chi-square Goodness-of-fit Test.
Kolmogorov-Smirnov Test
This approach employs the KS test, as described in Kolmogorov-Smirnov Test to calculate Dn. There is a significant result when Dn is greater than the critical value Dcrit. The critical value is calculated by dividing the value in Figure 1 by √n + .12 + .11/√n, where n is the size of the sample.
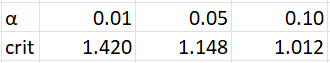
Figure 1 – KS test critical values
Anderson-Darling Test
This approach calculates the AD test statistic as follows.
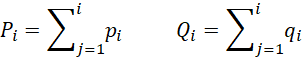
First, let n = the sample size, pi = the expected probability of digit i = log10(1 + 1/i) (see Figure 1 of Benford Distribution), and qi = the observed proportion for digit i (i.e. qi = fi/n where fi is the frequency of i as the first significant digit in the sample). Now let Pi and Qi be the associated cumulative probabilities/proportions, i.e.
Finally, calculate the AD test statistic as follows
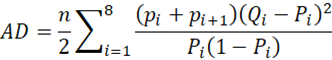
There is a significant result when AD is greater than the critical value, as shown in Figure 2.
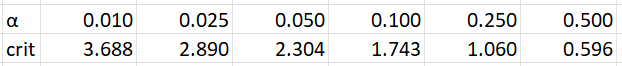
Figure 2 – AD test critical values
Examples
Example 1: Apply all three techniques to determine whether the data on the left side of Figure 3 obeys Benford’s law.
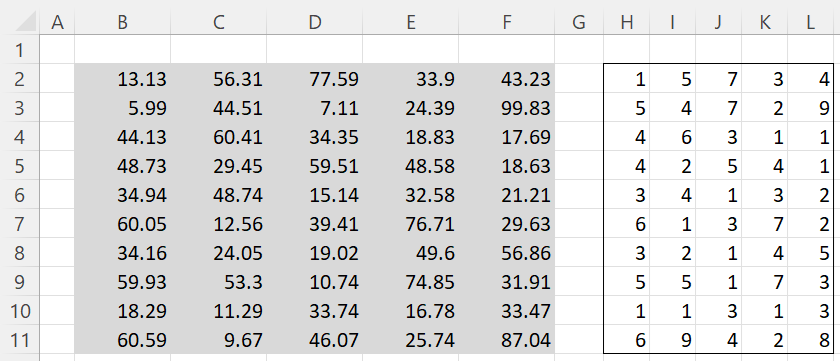
Figure 3 – Data + first significant digit
For each of the 50 values in range B2:F11, we display the first significant digit in range H2:L11. E.g. the first significant digit of 13.13 (cell B2) can be calculated by the formula =TRUNC(B2/10). This approach works well for all the data in Figure 4, but wouldn’t work if one of the data elements were .1313, in which case the value 0 would be returned.
In general, we can use the following Excel formula to obtain the first significant digit.
=NUMBERVALUE((LEFT(TEXT(B2,”0.000000000000000E+00″))))
The NUMBERVALUE worksheet function can be replaced by the VALUE function, which is especially useful for versions of Excel prior to Excel 2013. Alternatively, you can use the Real Statistics worksheet formula FIRST_SIG(B2).
Chi-square Test
We can now use the data on the right side of Figure 3 to perform the chi-square test, using the approach described in Example 3 of Chi-square Goodness-of-fit Test. The result is shown in Figure 4.
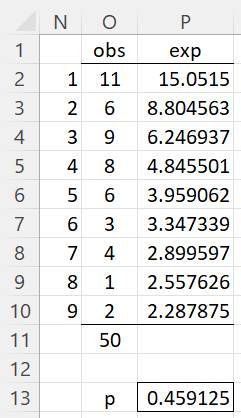
Figure 4 – Chi-square test
For each of the digits 1 through 9 shown in column N, we display the observed number of data values with that first significant digit. E.g. cell O2 contains the formula =COUNTIF($H$2:$L$11,N2). The expected number of data values for each significant digit is shown in column P. E.g. cell P2 contains the formula =O$11*LOG10(1+1/N2) where O11 contains the formula =SUM(O2:O10).
We now calculate the p-value of the test, shown in cell P13, by using the formula =CHISQ.TEST(O2:O10,P2:P10). Since p-value = .459125 > .05 = α, we conclude there is not sufficient evidence that the original data doesn’t follow Benford’s law.
Anderson-Darling Test
We apply the AD Test as described above using the data in range H2:L11 of Figure 3. The results are shown in Figure 5.
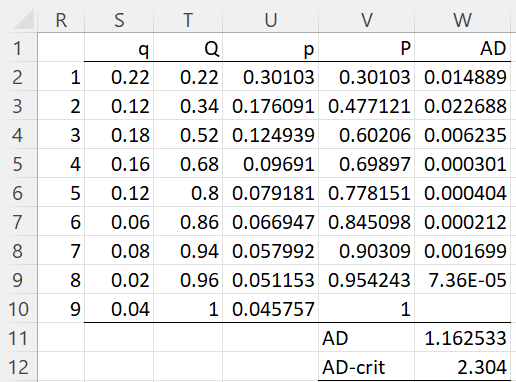
Figure 5 – Anderson-Darling Test
Some representative formulas from Figure 5 are shown in Figure 6. These include references to cells from column O of Figure 4.
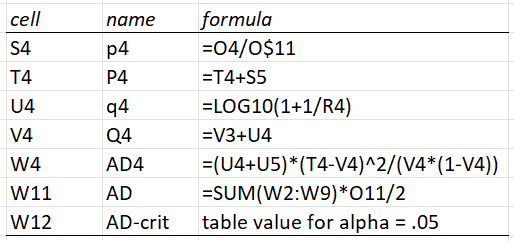
Figure 6 – Representative formulas
Since the AD-stat of 1.162533 is less than the critical value of 2.304 from Figure 2, we again conclude there is not sufficient evidence that the original data doesn’t follow Benford’s law. As we will see shortly, the estimated p-value is .217872.
Kolmogorov-Smirnov Test
We now apply the KS Test using the data in range H2:L11 of Figure 3. The results are shown in Figure 7.
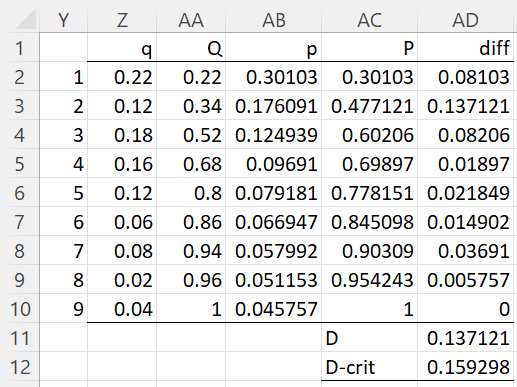
Figure 7 – KS Test
Columns Y through AC are obtained as for the AD test. The test statistic is the maximum difference between the absolute values of the cumulative observed and expected values. E.g. cell AD4 contains the formula =ABS(AC4-AA4) and cell AD11 contains the formula =MAX(AD2:AD10).
The critical value shown in cell AD12 is obtained via the formula =1.148/(SQRT(O11)+0.12+0.11/SQRT(O11)). Here, 1.148 is the value in Figure 1 for alpha = .05.
Since D < D-crit, once again we conclude there is not sufficient evidence that the original data doesn’t follow Benford’s law
Real Statistics Support
Click here for information about Real Statistics worksheet functions that can be used to perform the above goodness-of-fit tests for Benford’s distribution.
Examples Workbook
Click here to download the Excel workbook with the examples described on this webpage.
Links
References
Wikipedia (2022) Benford’s law
https://en.wikipedia.org/wiki/Benford%27s_law
Morrow, J. (2010) Benford’s law, families of distributions and a test basis
http://www.johnmorrow.info/projects/benford/benfordMain.pdf
Lesperance, M., Reed, W. J., Stephens, M. A., Tsao, C., Wiltons, B. (2016) Assessing conformance with Benford’s Law: Goodness-of-fit tests and simultaneous confidence intervals. PLoS ONE
https://doi.org/10.1371%2Fjournal.pone.0151235
https://www.ncbi.nlm.nih.gov/pmc/articles/PMC4809611/
Charles, first of all, congratulations on your work, as it is incredible!
Where can I get the source of the formula described in the AD test you used and the number 8 in the formula is the degrees of freedom? The ADcri = 2.304 was calculated specifically for the Benford distribution, could you share the calculation sheet?
Finally, to perform the tests using Real Statistics, I must select “Goodness of Fit” > “Two sample AD (freq data), but what is the distribution, the normal one?
Thanks
Hello Candeia,
1. There are 9 initial digits, and so the degrees of freedom df = 9-1 = 8. The calculation ADcrit = 2.304 was probably done via a simulation, as explained in one of the references on this webpage.
2. The Goodness of Fit data analysis tool does support the Benford distribution. You need to use the worksheet function described at
https://real-statistics.com/non-parametric-tests/goodness-of-fit-tests/goodness-of-fit-benford-distribution/benford-distribution-fitting-support/
Charles