We now describe how to calculate exact p-values and values for -crit without using the normal approximation. In fact, this approach is used to create the table of critical values (see Signed Rank Table). Technically, this approach is accurate for samples without ties, although the results will still be pretty accurate unless there are a lot of ties.
Example
Example 1: Repeat the analysis for Example 3 of the Wilcoxon Signed Ranks Test using the data in Figure 1.
![]()
Figure 1 – Wilcoxon Signed Ranks Exact Test
Note that the ranks of the absolute values of the differences (column F) take the values 1, 2, 3, 4, 5, and 6 (with no repetitions since we are not allowing ties and we have eliminated the sample item that has 0 as its difference). We are interested in the distribution of T+, i.e. all possible values for the sums of the ranks for the positive entries.
All possible combinations
Figure 2 shows all possible combinations of ranks for positive and negative entries, where 1’s correspond to positive entries and 0’s correspond to negative entries (range A5:BM12, displayed in two blocks so that they fit on the page). E.g. column U corresponds to the case where ranks 1, 3, and 4 are for positive entries, and ranks 2, 5, and 6 are for negative entries. Column AS corresponds to the situation in Example 1 (as shown in columns G and H of Figure 1).
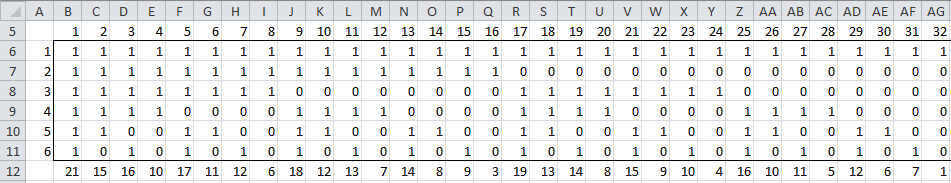
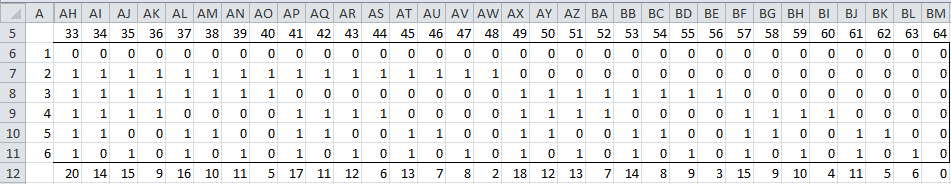
Figure 2 – Distribution of ranks
The cells in row 12 contain the T+ values for the entries in that column. E.g. the sum of 8 in cell U12 is calculated by the formula =SUMPRODUCT($A6:$A11,U6:U11). These values range from 0 (column BM) to 1+2+3+4+5+6 = 21 (column B).
Note that 21 = (6·7)/2, or in general n(n+1)/2. We see that the value in AS12 is 6, which matches the value calculated in cell G11 of Figure 1. Note too that there are 26 = 64 data columns in the table in Figure 2. In general, this value is 2n.
Permutation Distribution
The data in Figure 2 helps us calculate what we are really interested in, namely, the distribution of all possible values of T+. This distribution, which we will call the (one-sample) permutation distribution, is shown in Figure 3.
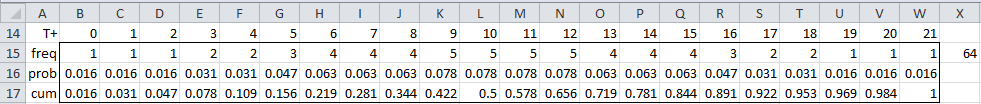
Figure 3 – Distribution of T+
Since the possible values of T+ range from 0 to 21, we see there are 22 data entries in the table. The frequency of each of the T+ values is shown in row 15. E.g. the frequency value when T+ = 6 (i.e. cell H15) is calculated by the formula =COUNTIF($B12:$BM12,H14) and has a value of 4.
As we observed previously, the sum of all these frequencies (cell X15) is 64. The probabilities of any T+ value are shown in row 16, and the cumulative probabilities are shown in row 17. E.g. the probability that T+ has value 6 is 4/64 = .063 (cell H16) using the formula =H15/$X15. The cumulative probability is .219 (cell H17), using the formula =G17+H16.
Note too that the distribution shown in Figure 3 is symmetric around the value 21/2 = 10.5.
Analysis
Since p-value = .219 > .05 = α, we conclude (one-tailed test) that there is no significant difference between the population median and 30. This is also true of the two-tailed test since .219 > .025 = α/2 (or by symmetry, p-value = .438 > .05 = α).
We also note that the first value of T+ whose p-value ≥ .05 is T+ = 3. This means that for values of T+ ≤ 2 there is a significant difference between the population median and 30 based on a one-tailed test with α =.05, or a two-tailed test with α =.1. Note that for n = 6 and α = .1, the critical value for a two-tailed test shown in the Signed Ranks Table is T+ = 2.
For all values of T+ in the closed interval [3, 18], the null hypothesis is not rejected (with 90% confidence), while for values outside this range, the null hypothesis is rejected.
Worksheet Functions
Real Statistics Functions: The Real Statistics Resource Pack contains the following functions that calculate the exact p-value and critical value for the Wilcoxon signed-ranks test.
PERMDIST(x, n, cum) = value of the permutation distribution at x based on n elements; returns the pdf value at x if cum = FALSE and the cdf value if cum = TRUE
PERMINV(p, n) = inverse of the permutation distribution at p; i.e. the least value of x such that PERMDIST(x, n, TRUE) ≥ p
SRDIST(x, n, tails) = p-value of the signed-ranks exact distribution at x based a sample with on elements where tails = 1 or 2 (default)
SRINV(p, n, tails) = inverse of the signed-ranks exact distribution at p; i.e. the least value of x such that SRDIST(x, n, tails) ≥ p where tails = 1 or 2 (default)
SR_EXACT(R1, R2, tails) = p-value of the paired signed-ranks exact test on the data in R1 and R2, where tails = 1 or 2 (default)
SR_EXACT(R1, med, tails) = p-value of the one-sample signed-ranks exact test on the data in R1 and hypothetical median med (default 0), where tails = 1 or 2 (default)
Here, n is the sample size less any elements that match the hypothetical median in the single sample case, and less any sample pairs that are equal in the paired samples case.
Observations
Note that =SR_EXACT(R1, R2, 1) is equivalent to
=PERMDIST(SRANK(R1, R2), COUNTIF(R1,”<>”&R2))
and similarly for SR_EXACT(R1, med).
Also note that if x < n(n+1)/4, then
SRDIST(x, n, 1) = PERMDIST(x, n)
SRDIST(x, n, 2) = 2*PERMDIST(x, n)
while if x ≥ n(n+1)/4, then
SRDIST(x, n, 1) = 1–PERMDIST(x, n)
SRDIST(x, n, 2) = 2*(1–PERMDIST(x, n))
Also, if p ≤ .5, then
SRINV(p, n, 1) = PERMINV(p, n)
SRINV(p, n, 2) = PERMINV(p/2, n)
while if p > .5, then
SRINV(p, n, 1) = PERMINV(1–p, n)
SRINV(p, n, 2) = PERMINV((1–p)/2, n)
For the two-tailed test for Example 1, we have
SRDIST(6, 6, 2) = .4375
SRINV(.05, 6, 2) = 0
SR_EXACT(B4:B10, 30) = .4375
Speeding up the calculations
The approach described above for manually calculating the exact p-values is quite slow. Instead, we can use the following properties to recursively perform the calculations.
For samples of size n > 1, the sampling frequency of the T statistic fn(T) has the following property:
![]()
for values of T between 0 and C(n+1, 2). Also, f1(0) = f1(1) = 1 and fn(T) = 0 for all value of T < 0 or T > C(n+1, 2).
Example
Example 2: Calculate the frequency function f5(T) for all possible values of T.
T takes values from 0 to C(5+1, 2) = 15. To calculate f5(T) for these values of T, we first need to calculate the values of fm(T) for all values of m = 1, 2, 3, 4, and for all values of T = -5, -4, …, 14, 15. This is shown in Figure 4.
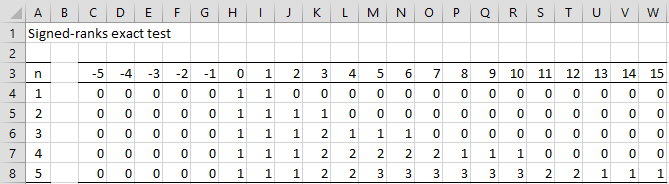
Figure 4 – Signed-Ranks Exact Test
We start by filling in the value of zero for T < 0 (columns C through G). We next fill in the values for row 4, namely 1 for T = 0 or 1 and 0 elsewhere.
We now place the formula =H4+OFFSET(H4,0,-$A5) in cell H5, highlight the range H5:W8, and then press Ctrl-R and Ctrl-D.
From row 8, we get the frequencies and cumulative distribution values for samples of size 5, as shown in Figure 5.
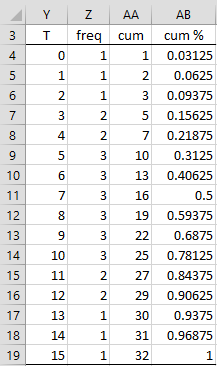
Figure 5 – Exact distribution
Columns Y and Z are the transposes of rows 3 and 8 from Figure 4. As usual, column AA is calculated by placing the formula =Z3+AA4 in cell AA4, highlighting the range AA4:AA19, and pressing Ctrl-D. Column AB is calculated by placing the formula =AA4/AA$19 in cell AB4, highlighting range AB4:AB19, and pressing Ctrl-D.
Note that the value of 32 in cell AA19 is 25. In general, the denominator used to calculate the cumulative distribution value is 2n, where n is the sample size.
Note that =PERMDIST(10,5) has the value .78125, as shown in cell AB14 of Figure 5. Also =SRDIST(4,5,2) has the value 2*.21875 = .43750.
Worksheet Array Function
Real Statistics Function: The Real Statistics Resource Pack contains the following array function that calculates the complete range of exact p-values for the specified sample size.
PERM_DIST(n, cum) returns a column array with the p-values of the Signed-Ranks exact test for values of T from 0 to C(n+1,2) when cum = TRUE (default) and the frequency values when cum = FALSE.
The formula =PERM_DIST(5) returns the array in range AB4:AB19 of Figure 5, and the formula =PERM_DIST(5,FALSE) returns the array in range Z4:Z19.
The functions PERMDIST, PERMINV, SRDIST, SRINV, SR_EXACT, and PERM_DIST work pretty well for values of n up to 500. You will be able to use larger sample sizes, but calculation times may become unacceptably long, or overflow errors may occur.
Examples Workbook
Click here to download the Excel workbook with the examples described on this webpage.
Links
References
Wikipedia (2018) Wilcoxon signed-rank test
https://en.wikipedia.org/wiki/Wilcoxon_signed-rank_test
https://labs.la.utexas.edu/gilden/files/2016/05/Statistics-Text.pdf
Can I do a Wilcoxon rank sum test if the only available data are the median and IQR for two populations (I don’t have the full dataset available, only these summary values)?
Henry,
Perhaps, although I doubt it. I don’t know how to do such a test.
Charles
Hi,
I have been having real difficult time understanding how the hypothesis of Wilcoxon signed rank test works especially in cases for small samples. Please look at my sample below. The data is clearly very far apart from each other but my SAS results or the 2*permdist function gives me a p value > than .05 (=.0625). How is this possible? While in cases where there is no significant difference , i get p values < .05.
Data
Actual Forecast
2.21 2.21
0.63 3.51
0.63 6.08
0.63 2.52
0.76 2.37
0.76 2.26
I really appreciate any help with this.
Thanks !
The two-tailed p-value for the exact test is .0625 as you have said. The likely reason why you can’t reject the null hypothesis is that the sample is so small. Recall that not rejecting the null hypothesis is not the same thing as saying that the null hypothesis is true. With such a small sample it is hard to reject the null hypothesis.
Note that the p-value using the normal approximation is .043.
Charles
Do you think we should use normal approximation? I use SAS Proc Univariate (Exact test method)and its same as Permdist in Real stat.
For small sample is the normal approximation method right?
The normal approximation is better for larger samples, although the normal approximation is generally pretty good for samples of size >= 10). For very small samples you can use PERMDIST or even the SRANK_EXACT or SRANKPair_EXACT functions.
Charles
Thanks a lot for your help !! This is very helpful !
Dear Dr Zaiontz,
thank you so much for your prompt reply. Unfortunately, I must have done something incorrectly, as I don’t get the expected results. I wonder if you would mind having a look at a small test spreadsheet I’ve made – I’ve sent it to your email address.
Thank you again
Marco
Dear Dr. Zaiontz,
thank you for a wonderful resource, it is certainly making my life easier!
Could I clarify something with you – is there an easy way to calculate the exact p-value for the Wilcoxon two tailed signed rank test? I’m using SRTESTPair at the moment, but something like MANN_EXACT would be fantastic. I only have small numbers, so the computational requirements wouldn’t be an issue…
Many thanks for your help,
Marco
The formula PERMDIST(SRankPair(R1, R2),COUNTIF(R1,”<>“&R2),TRUE) serves the same purpose for the one tailed test. For the two tailed test just double the answer.
Here SRankPair(R1, R2) = T for a pair of samples contained in ranges R1 and R2, where both R1 and R2 have only column, one for each paired sample.
and PERMDIST(x,n,TRUE) = value of the permutation cumulative distribution at x based on n elements