Objective
We can use simulation to estimate the p-values of the Wilcoxon Signed-Ranks test. This approach will give approximate values, more accurate as the number of simulations is increased, but will also take ties into account.
Example
Example 1: Determine the approximate p-value for Example 3 of the Wilcoxon Signed-Ranks Test using simulation. The ranks of the absolute values of data elements minus the median (shown in Figure 5 of Wilcoxon Signed-Ranks Test) are repeated in range G4:G18 of Figure 1.
We start by showing how to perform the simulation based on 20 samples in Figure 1.
In each simulated sample, the rank values from column G are randomly assigned a plus or minus sign, and the simulated T statistic is then defined to be the sum of the plus values. E.g. cell H4 contains the formula =IF($G4<>””,RANDBETWEEN(0,1)*$G4,””) and cell H20 contains the formula =SUM(H4:H18).
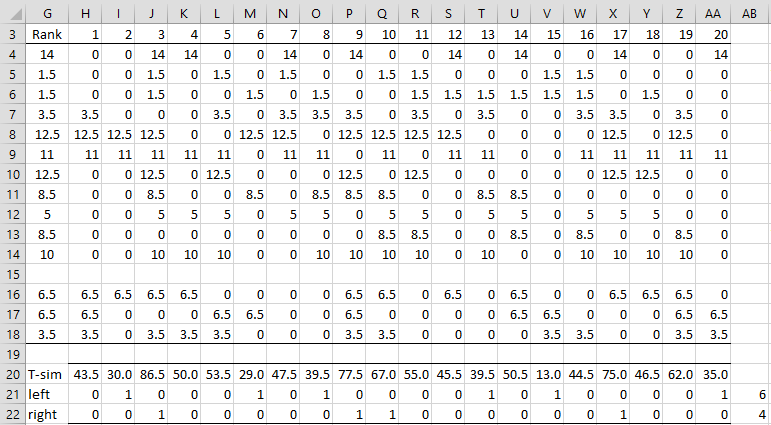
Figure 1 – Signed-ranks simulation
To estimate the left-hand one-tailed p-value, we count the number of times the simulated T value is less than or equal to the actual T value, namely 40.5, as calculated by =SRANK(B4:B18, 20), referring to Figure 5 of Wilcoxon Signed-Ranks Test. We see that 6 of the samples meet this condition, namely, samples 2, 6, 8, 13, 15, and 20, as recorded in cell AB21. Thus, the left-tailed p-value is 6/20 = .30 based on this sample.
We estimate the right-tailed p-value in a similar way, based on the right-tailed equivalent of T = 40.5, namely 64.5, as shown in cell AB38 of Figure 7 of Wilcoxon Signed-Ranks Test. This value can be calculated as T′ = C(n+1, 2) – T, which for this example is C(15, 2)–40.5 = 105–40.5 = 64.5. We see that 4 of the samples (3, 9, 10, and 17) are greater than or equal to 64.5, as recorded in cell AB22. Thus, the right-tailed p-value is 4/20 = .20. The two-tailed p-value is therefore = .30 + .20 = .50.
Results
These results are summarized in Figure 2. Note that this sample is quite small, and so we shouldn’t expect the results to be that accurate. Also note that because of the presence of ties, the right-tailed and left-tailed p-values don’t necessarily have to be equal (even if we had exact values).
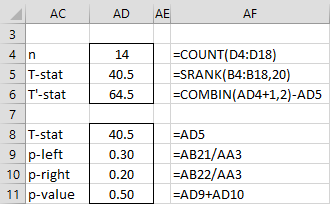
Figure 2 – Simulation results
Worksheet Function
Real Statistics Function: The Real Statistics Pack also provides the following array function for the simulation version of the signed-ranks test for the sample in range R1 and hypothetical median med or for the two samples in R1 and R2, where iter is the number of simulations (default 10,000).
SR_SIMUL(R1, med, lab, iter): returns a column array with the T statistic, i.e. T = SRANK(R1, med), the p-value for the left-tailed test of, the p-value for the right-tailed test and the p-value for the two-tailed test; if lab = TRUE (default FALSE) then an extra column of labels is appended to the output.
SR_SIMUL(R1, R2, lab, iter): returns a column array with the T statistic, i.e. T = SRANK(R1, R2), the p-value for the left-tailed test of, the p-value for the right-tailed test and the p-value for the two-tailed test; if lab = TRUE (default FALSE) then an extra column of labels is appended to the output.
For Example 1, the output of MW_SIMUL(B4:B18,20,TRUE) is shown in Figure 3. Note that since the results are based on 10,000 samples, instead, of only 20 in the analysis demonstrated above, we expect them to be more accurate.
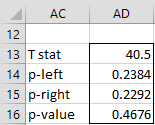
Figure 3 – Simulation results using SR_SIMUL
Examples Workbook
Click here to download the Excel workbook with the examples described on this webpage.
Links
References
Wikipedia (2018) Wilcoxon signed-rank test
https://en.wikipedia.org/wiki/Wilcoxon_signed-rank_test
https://labs.la.utexas.edu/gilden/files/2016/05/Statistics-Text.pdf
NCSS (2023) Tests for paired means (simulation)
https://www.ncss.com/wp-content/themes/ncss/pdf/Procedures/PASS/Tests_for_Paired_Means-Simulation.pdf