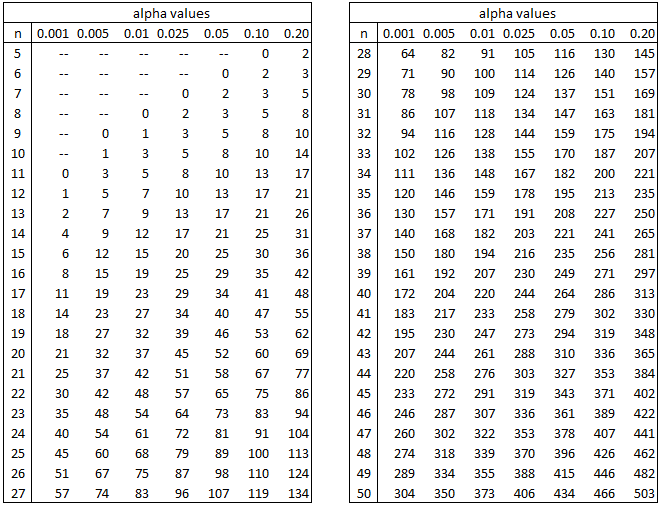
The following table provides the critical values for two-tailed tests. For a one-tailed test, double the alpha value and use the table. See Wilcoxon Signed-Ranks Test for details about the test.
Links
Download Table
Click here to download the Excel workbook with the above table.
References
Howell, D. C. (2010) Statistical methods for psychology (7th ed.). Wadsworth, Cengage Learning.
https://labs.la.utexas.edu/gilden/files/2016/05/Statistics-Text.pdf
Sani, F., Todman, J. (2006) Experimental design and statistics for psychology: Statistical tables. Wiley
https://books.google.com/books/about/Experimental_Design_and_Statistics_for_P.html?id=XrL2RxhM-ZkC
Sulivan, L. (2016) Nonparametric tests: critical values for signed-ranks test
http://sphweb.bumc.bu.edu/otlt/MPH-Modules/BS/BS704_Nonparametric/Wilcoxon-Signed%20Rank-Table.pdf
hello bro how to + value in this tabel
Sorry but I don’t understand your question. Can you explain further?
Charles
“hello bro” LMAO
Hi,
How can we import the Z-table into R language?
Instead of using many functions, we want have all the results in a single function. How do we do it?
Thanks.
Sorry, but I only have limited knowledge of R.
Charles
Hello Sir, I have n1=6 and n2= 13. R1 67,5 and R2 122,5. As my R_stat I´ll choose the smaller samples rank sum right? secondly wich table can I find the R_critical for alfa 0,05. The n2 has way more samples.
Hello Yu,
Are you sure that you want to use the Signed Ranks Test? It seems that you have two samples of different sizes. Perhaps you want the Mann-Whitney test (or even the t-test).
Charles
What if my n = 100.
How do i do that?
Michelle,
With a sample size this large, you need to use the normal approximation approach, as described at
https://www.real-statistics.com/non-parametric-tests/wilcoxon-signed-ranks-test/
Charles
Hi!
What if my N=60 ?
Regards!
Nathalia,
With such a large sample, you shouldn’t use the table. Instead, you should use the normal approximation as explained at
Wilcoxon Signed Ranks Test
Charles
Hello
How about n=5 please?
Betti,
When n = 5, the sample is too small for the test to make a determination.
Charles
Hello,
Firstly thank you for you feed it is amazing!!
I have n= 6. Do I understand I must increase by 2 to attempt a 0.05 value.
Or stick to 6 for p=0.10
And the critical values are the positive pairs?
Kindest regards
Hi Patrick,
The larger the sample size n, the better your test. You can use the test even with n = 7 and alpha = .
I don’t know what you mean by “positive pairs”.
Charles
Hi
I have an n=16 sample size. the total rank of positives 104,5 and the total rank of negatives
is 31,5.
For alpha=0,05 critical value is 29 I must compare the small rank(31,5) with the critical value and do not reject H0
for alpha=0,10 critical value is 35 compare 31,5 and reject H0. Am I right?
Hi Alexander,
It seems to be correct.
Charles
How about if n=4?
The values for n = 4 are –, which you can assume means that the critical values are -1; i.e. no test value will be less than this critical value. In other words, with a sample of such a small size, it is not possible to obtain a significant test result.
Charles
Hi.. When the w table = 3 and w value = 4. We accept the H0 right? But with my homework it doesn’t make any sense since the w- = 4 and w+ = 32. So it gives a hint to reject the H0, is this correct?
And thank you for the w table.
Nada,
Since you use W instead of T and refer to W+ and W- are you using the Wilcoxon Rank Sum Test (instead of the Wilcoxon Signed-Ranks Test, which is what this table refers to)?
Charles
What is the two tailed critical value for a sample size of 61 and an alpha value of 0.05?
Samaa,
For n > 50 you can’t use the table. Instead, you can use the normal approximation as described at
https://www.real-statistics.com/non-parametric-tests/wilcoxon-signed-ranks-test/
Charles
if w value = w table, how to write the conclusion ?
The critical value is the value that a test statistic must exceed in order for the null hypothesis to be rejected. Thus, at the critical value the null hypothesis is not rejected.
If the p-value = alpha (the significance level) then based on this definition the null hypothesis is not rejected (i.e. there isn’t a significant result). Clearly, this is a borderline result and is somewhat arbitrary.
Charles
Hello, could I ask how I can interpret Friedman + Wilcoxon Signed Rank tests in a table for an academic paper? Which values I should use (there are lots in the output, means, medians, mean ranks (positive negative values) next to the t-test and p value?
Many thanks!
Hello Sam,
I assume by Friedman + Wilcoxon Signed Rank tests, you mean that you conducted Friedman’s test and got a significant result and so you then performed one or more Wilcoxon Signed Rank tests as follow-up to pinpoint where the significant comparisons are.
Use the parts of the output that demonstrate these results. The format that you should use depends on guidelines used by the journal or conference, etc.
Charles
Hi, i want to know where i need to look for critical value if the n is less than 5
The table does not include such values since for such small samples there are no critical values.
Charles
Hi Charles, if there are no critical values for small samples (n=3), how can I test the difference?
You won’t be able to use this test with such a small sample. In fact, with such a small sample you can’t expect much from any test.
Charles
Help me understanding the critical value of Wilcoxon. How are critical values are set in the table for different Please….
Hello Farhad,
The critical values can be calculated using the exact test, as described at
https://real-statistics.com/non-parametric-tests/wilcoxon-rank-sum-test/wilcoxon-rank-sum-exact-test/
Charles
Thanks for your help
Why are these values very different from those obtained using the normal approximation at high n? The O’Reilly table (https://www.oreilly.com/library/view/nonparametric-statistics-a/9781118840429/bapp02.xhtml) for n=30 and alpha (two tailed) < 0.1 gives a critical value for T of 151, which fits very closely with what is obtained from a normal approximation (even the one linked to on this site: https://real-statistics.com/non-parametric-tests/wilcoxon-signed-ranks-test/wilcoxon-signed-ranks-test-advanced/, i.e. (30*31)/4 – inverse_normal_cdf(0.95)*sqrt(30*(30+1)*(60+1)/24) = 152.5). However, in this table, at n=30 and alpha=0.1, the critical value is listed as 3, which is considerably more stringent!
In your last sentence you state that at n = 30 and alpha = .1 the critical value is listed as 3. Since as you previously stated that this value is 151, you probably mean something else. Please restate your observation.
Charles
…the observation is that the table you have presented here, where (at n = 30 and alpha = .1) the critical value is listed as 3, is very different from the O’Reilly table, where (for n=30 and alpha < 0.1), the critical value is 151. This is a very big difference. How do you reconcile this difference?
Hello Avanti,
Thanks for bringing this problem to my attention. The problem is that the second half of the table was simply a replication of the first part of the table. I have now corrected this and you should now find the correct table values.
Charles
n is number of pair ?
Yes
What is the difference between using the wilcoxon and the student t-test
Ibrahim,
You use the Wilcoxon Signed/Ranks test instead of the t test when the normality assumption for the t test is violated.
Charles
Dear all,
Does anyone know what the critical values are for higher values of alpha (e.g. alpha =0.2, 0.3, 0.4) ? I did not find any such tables online, though these would be very useful for my application.
Jellis,
I am about to issue a new release of the Real Statistics software which will calculate these values for you. I will also update the existing table to include the values for alpha = .2
Charles
Como obtener estos valores, tendras la fórmula para calcular la tabla manualmente?
I used the approach described on the following webpage to produce the table.
https://www.real-statistics.com/non-parametric-tests/wilcoxon-signed-ranks-test/wilcoxon-signed-ranks-exact-test/
Charles
I am stuck at finding critical values for my one-sample wilcoxon signed rank test. Can you please tell me what would the two-tail critical value be for n=132. I would be really thankful
Pulkesh,
For such a high value of n, you don’t need to use the table of critical values. Instead you should use the normal approximation, as described on the following webpage:
Wilcoxon Signed-Ranks Test
Charles
need help solving this question “A machine which fills orange squash bottles should be set to deliver 725 ml,A sample of 50 bottles is checked and the mean quantity is found to be 721 ml and the sample standard deviation 13 ml.does this differ signficantly from 725 ml at 1% level of significance?”
Yes, you can do this using the one-sample t test. See the following webpage:
https://real-statistics.com/students-t-distribution/one-sample-t-test/
Charles
Can we generate z-score from Wilcoxon Signed Rank Test for small sample data? Currently I’m using SPSS as my statistical tools.
Sorry, but I don’t know whether SPSS provides a z-score for small samples. The typical approach is to use the z-score for large samples (20 or so elements). I am sure this is provided by SPSS. It is also included in the Real Statistics Wilcoxon Signed Rank Test data analysis tool and SRank function.
Charles
Hi
If I have a sample size of 1645 can you advise if this test can be used and if so what the critical value would be for a data set of this size? If this is not the appropriate test can you please advise what would be?
Many Thanks
Hi Victoria,
You can use this test with a sample of 1645, but you don’t need to use a table of critical values. Instead you should use the normal approximation as described in Wilcoxon Signed-Ranks Test.
Charles
In the case that with my large sample, it is not in fact normally distributed (I know this because I have run several normality tests and a histogram to prove), how to I proceed to interpret the Wilcoxon test statistic? Mine is very large, 9903.Thank you
Mai,
You can use Wilcoxon Signed-Ranks test even with data that is not normally distributed. See the following webpage for details
Wilcoxon Signed-Ranks Test
Charles
Mai,
Normality is not a requirement for the Wilcoxon signed ranks test.
The requirement instead is that the distribution of paired differences be relatively symmetric. See the following webpage for more details:
https://real-statistics.com/non-parametric-tests/wilcoxon-signed-ranks-test/
Charles
Hi..I am trying to used Wilcoxon signed rank test on a very large dataset. The sample size is around 30000. Does the test work on large sample size like this?
The test does work on such a large sample (using the normal approximation). I believe that the version provided by the Real Statistics Resource Pack does work on this size data set. I have tested it on large data sets, but I can’t recall what the largest size was. The easiest way to confirm that it works is to try it.
Charles
I downloaded the service pack. Thank you! But how do I format Column F so it contains the adjusted rankings of the non-zero values in column E?
Lucia,
This is explained on the webpage https://real-statistics.com/non-parametric-tests/wilcoxon-signed-ranks-test/. You need to use Excel’s RANK.AVG function.
Charles
Hi Sir.
May I know if Wilcoxon Test may be applied if you only have n=5. If not what may be an alternative test?
Thank you.
Robert,
The Wilcoxon Signed-Ranks Test can be applied with n = 5, but don’t expect much from the test since the sample size is so small. Only with a high value for alpha and extremely lopsided data will you find out anything. With so little data, there isn’t much that is meaningful that you can do. You can try the sign test.
Charles
Is there a formula or approximation for extrapolating to higher values of N?
Just apply the normal approximation as described on the webpage https://real-statistics.com/non-parametric-tests/wilcoxon-signed-ranks-test/
Charles
“For a 1-tail test, double the alpha value and use the table.”
Correct me if I’m wrong, but for a one tailed test shouldn’t I cut the alpha in half and use this chart?
Mike,
The table contains the critical values for the two-tailed test. For the one-tailed test you definitely need to double the value of alpha and use that column in the table.
Charles
Hi, Mike! I was asking myself the same question. Here I share another table and information about the test and you can decide for yourself. Good luck!
http://sphweb.bumc.bu.edu/otlt/MPH-Modules/BS/BS704_Nonparametric/BS704_Nonparametric6.html
Please how do I simulate for the most powerful willcoxom signed rank test using R software