We now show how to perform ANCOVA based on ANOVA instead of regression.
Examples
Example 1: Redo Example 1 of Basic Concepts of ANCOVA using an ANOVA approach to ANCOVA.
We start by calculating the slopes of the regression lines of the reading scores for each method versus the family income of the children in that sample based on the raw data in Figure 1 of Basic Concepts of ANCOVA. The results are displayed in Figure 1.

Figure 1 – Slopes of regression lines for Example 1
The table in Figure 1 presents some representative formulas from Figure 2.

Figure 2 – Representative formulas from Figure 1
The next step is to run a one-way ANOVA on the reading scores (input data range B5:E15) and another on the family incomes (input data range G5:J15) using either Excel’s Anova: Single Factor data analysis tool or the Real Statistics Single Factor Anova data analysis tool (see Figure 3).

Figure 3 – ANOVA on reading scores and family income
Using the results from Figures 1 and 3, we can now create (in Figure 4) the same two versions of ANCOVA that appear in Figures 3 and 4 of Regression Approach to ANCOVA.

Figure 4 – ANCOVA for Example 1
To see how this is done, we show in Figure 5 some representative formulas from Figure 4.
 Figure 5 – Representative formulas from Figure 4
Data Analysis Tool
Real Statistics Data Analysis Tool: The Real Statistics Resource Pack provides the ANCOVA data analysis tool.
To use the tool for the analysis of Example 1, click on cell L1 (where the output will start), press Ctrl-m, and select the Ancova option from the Anova tab (or from the Analysis of Variance dialog box if using the original user interface). Next, fill in the dialog box that appears as shown in Figure 6.
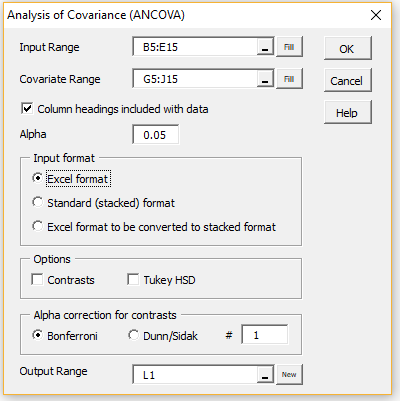
Figure 6 – Dialog box for Analysis of Covariance
The output is shown in Figure 7.

Figure 7 – Analysis of Covariance data analysis tool
See ANCOVA Analysis Tools for more details.
Links
Examples Workbook
Click here to download the Excel workbook with the examples described on this webpage.
References
Howell, D. C. (2010) Statistical methods for psychology (7th ed.). Wadsworth, Cengage Learning.
https://labs.la.utexas.edu/gilden/files/2016/05/Statistics-Text.pdf
Schmuller, J. (2009) Statistical analysis with Excel for dummies. Wiley
https://www.oreilly.com/library/view/statistical-analysis-with/9780470454060/
Hi,
I’ve been scratching my head ever since I’ve noticed that in your ANCOVA complete model the total SS does not add up to 4901.88 (1678.35 + 571.03 + 1768.52 = 4017.90). What is the reason for it? Especially when the calculation of the total SS in the reduced model relies on the sum of SS between and SS within.
I’ve tried to replicate your procedure on different data set and it worked. I got the same values using SPSS. But still the addition of all variation sources SS if SS for the covariate is included does not equal the SS total. What am I missing here?
One more good thing: Nice solution with using the SS (=DEVSQ() ) as weights instead of var (=VAR.P(), found in the book of Schmuller) for calculation of the slope . It makes the ANCOVA (with anova approach) procedure independent of the equal groups sizes.
Hi Mariusz,
1. The SS don’t need to sum up to the total SS. This true when no adjustments need to be made (e.g. balanced ANOVA models). For example, in the ANOVA model described in Figure 9 of https://real-statistics.com/multiple-regression/unbalanced-factorial-anova/ the SS sum to 14513.9 while SS for the total is 14702.07. In these cases something’s got to give.
2. I also liked Schmuller’s approach.
Charles
Dear Charles.
Why do I have to multiply G25 with K23 in order to get SS,cov? Why isn’t K23 already the part of the SS covariant variable, wich influences our y variable?
Thank you for your work,
Severin
Hello Severin,
Perhaps I don’t fully understand your question, but why would K23 already be part of SS?
Note that I have fixed an error in Figure 2 and have added a link to the Excel spreadsheets used on this webpage.
Charles
Hi, Charles. Could you help how to use your formula bar in realstat analysis tool, such as ancova 1 reg, semi part correl, q dist, stderr. And im actually strugling with calculate sum square type III manually for intercept, i really hope there is formula bar for it but if you dont mind could you help me to find the right formula till the result equal with spss 🙏🏻😭😭
Hello Lifta,
The output from the Real Statistics data analysis tool is a spreadsheet whose cells contain formulas. You can click on any cell to see what formula is used.
If you are using the Windows version of Excel you can use the formula bar fx for any Real Statistics function just as for any of the built-in Excel functions. If you enter any Real Statistics function and then press Ctrl-Shft-a you will see what the arguments for that function look like.
Charles
Good morning. How about if I have 2 covariates? What should I do? Thank you!
Hi Aldrin,
See ANCOVA Light
Charles
Hi,
I am trying to run real statistics tool for ANCOVA in my excel (Version 16.39) for MAC (Mojave 10.14.6). When I run ver() I get “7.2 Excel 2016/2019/365 Mac”. Every-time I enter the input range and covariant range and click ok afterwards, it shows me some error. Can you help me?
Hello Tasmia,
If you send me an Excel file with your data, I will try to figure out what is going wrong. What error message are you receiving_
Charles
Thanks sir.it is good way. I tried it.
Cannot replicate these results in spss.
Tests of Between-Subjects Effects
Dependent Variable: reading
Source Type III Sum of Squares df Mean Square F Sig.
Corrected Model 3131.320a 4 782.83 19.369 0
Intercept 61.296 1 61.296 1.517 0.227
income 1054.472 1 1054.472 26.09 0
group 2665.219 3 888.406 21.981 0
Error 1252.903 31 40.416
Total 13858 36
Corrected Total 4384.222 35
a R Squared = .714 (Adjusted R Squared = .677)
Tiago,
Are you saying that you can’t duplicate the results you got from SPSS when using Excel (or Real Statistics)?
If so, please send me an Excel file with the results you got.
Charles
Hello Prof. Charles, Thank you for the reply. What I mean is that, using the same dataset used in this example and running it on spss, the results are different, as above. I was trying to understand the mathematical basis for Analysis of Covariance and followed the calculations made on this page and then ran the data in spss with different results.
The dataset copied from spss is as follows
12 1 17.5
39 1 104.6
36 1 64.7
17 1 47
25 1 22
15 1 12.4
8 1 20
31 1 79.7
4 2 70.8
3 2 45.9
1 2 47.5
5 2 77.8
3 2 70.9
4 2 84.8
3 2 49.8
1 2 34.6
20 3 71.4
42 3 55
31 3 54
24 3 27.9
15 3 40.6
13 3 33
9 3 22.2
21 3 80.5
31 3 80
13 3 41
12 4 35
10 4 33
19 4 34.2
18 4 43.2
14 4 20
8 4 37
7 4 28.2
19 4 46.4
25 4 64.9
26 4 59.4
Further, many thanks for the extremely instructing website and the data analysis tool, it is very much admirable
Sorry, but I don’t use SPSS and so don’t know what to do with this data. If you email me an Excel file with the data properly formatted for the ANCOVA data analysis tool, I will try to help you.
Charles
Question,
what is the x for the P value? is it the F value? Thanks in advance
Francois,
Yes, x is F in the calculation of the p-value.
Charles
Hello;
How can I incorporate initial weight as covariant for final weight with
treatment number ——— 5
block number —————-5
Sorry, but I don’t understand your question.
Charles
Hello Charles,
Thank you for your valuable work here.
Question: So how do you interpret the result her?
a nice narrative result interpretation would be nice.
Steve
This is discussed on the webpage ANCOVA Basic Concepts.
For Example 1 on the referenced webpage, since p-value = .03194 < .04 (see Figure 4) we conclude that there is a significant difference between the reading scores of the 4 methods factoring out the effects of family income (i.e. excluding the influence of family income). Charles
Hello Charles!
Does your output have the results for the interaction of your factor and covariate method*income? If not, you wouldn’t happen have another analysis that will help?
Thanks so much!
Michelle,
I haven’t forgotten your question, but have not yet been able to allocate enough time to give you a suitable response.
Charles
Hello Charles,
This statistics package is really helpful. Is there a way to do post hoc test for ancova?
Best,
J
———-
Jay,
The website explains how to use contrasts (with or without a Bonferroni/Sidak correction) for post hoc testing. See the webpage
Contrasts for ANCOVA
You can also use Tukey’s HSD, but I haven’t included this on the website yet.
Charles
Real-Statistics is really great. Many thanks. I recommend it to my students. One small query – I think there’s an error in the calculation of the adjusted means in your ANCOVA output. The average term for the covariate is missing from the formula you are using.
Bill,
I believe that you are correct since the results are not the same as those using the regression method on the webpage ANCOVA using Regression.
I will take a look at this shortly and make any corrections necessary.
Thanks for bringing this to my attention.
Charles
Dear Charles,
I wonder why in Figure 4 (ANCOVA for Example 1), the P-value of Treatment is 0.031940102 which is not as the same as p-value of Between in Figure 7 (Analysis of Covariance data analysis tool)
Yours faithfully,
Tom
Dear Tom,
Sorry for taking so long to respond. There is a mistake in the output from the Real Statistics Ancova data analysis tool. I have alerted readers to this after Figure 7 and plan to fix this error in the next release of the software.
Thank you very much for catching this error. I am grateful to you and the many others who have helped improve the website and software.
Charles
hi,
i am trying to get ancova table but it always got compile error in hidden module. i followed all given steps precisely but same massage, please let me know from where/what mistake i am doing?
This sort of problem seems to come up from time to time, but I am not sure why. If you can answer the following questions I will try to figure out what has gone wrong:
1. What operating system are you using (Windows 8.1, 8.0, 7, Vista, XP, Mac OS)?
2. What version of Excel are you using (Excel 2013, 2011, 2010, 2007, 2003, 2002)?
3. Are you able to use any of the other Real Statistics data analysis tools without getting the “compile error in hidden module” error?
4. What value do you get when you enter the formula =VER() in any cell in the spreadsheet?
Charles
thankyou for responce Charles,
i am using windows 8.1, microsoft office 2007, and getting error for all of realstat analysis, correlation, anova, ancova and regression. =VER() in any column is okay(it calculates variance exactly). the massage of error displayed is from microsoft visual basic.
sohaib
Please check =VER() since it does not calculate variance.
Charles
I have got the same problem. RealStats-2007 does not work on my laptop. I use RealStats for Excel 2010 instead. My laptop is Win 7 Ultimate SP1, Office 2007, Excel 2010. The command =VER() in any column is okay with 4.2 in results.
Tom,
If I understand correctly, RealStats works properly for Excel 2010, but RealStats-2007 does not work. Is that correct?
Does =VER() work properly for RealStats-2007?
Does the version of Office 2007 that you are using also contain Access and Outlook?
Charles
Tom,
I have recently heard from others who are having problems specifically with Excel 2007 as part of Office 2007 Professional. I have also been given the suggestion that upgrading to the latest Office 2007 service pack (namely SP3) can resolve this type of problem, but I have not been able to test this myself.
Charles
Dear Charles,
Thanks for your advice about upgrading. I use Original MS Office 2007 Home and Student. Its version is 12.0.4518.1014. I do not install Outlook and Access. I will upgrade my office to SP3 (12.0.6611.1000) and test RealStats 2007 when I finish my report.
Tom
Hello,
Thanks so much for this resource.
Two questions about ANCOVA using RealStatistics:
1) Why does the input go all the way to row 17 instead of stopping at row 15? When I tried doing both of these, it gave me different output values, too, so I’d like to understand better why I wouldn’t stop at just the raw values.
2) I think there is a bug; when I tried to do the ANCOVA function in your example workbook, the output just lists “Method 1” as all of the 4 groups, and the adjusted means become “0”. The F and p also return errors rather than numbers.
Thanks for your help.
Charity
Charity,
1) The input should stop at row 15. The dialog box values are in error. The output is correct, however, and uses the data through row 15 only. Thanks for catching this error. I have made a notation on the webpage and shortly I will substitute the image with one containing the correct input ranges.
2) There is a bug in the headings when you place the output on a new worksheet. The headings are correct when you keep the output on the same page as the input. Thanks for finding this error as well. I will correct the software in the next release. When I ran the ANCOVA data analysis tool using the latest release (2.6.2), however, I did not get errors for F and p-value.
Charles
Thank you so much!! This was super helpful.
very helpful
Is the ANCOVA data analysis tool in the resource pack for MAC? I couldn’t seem to find it.
Thanks, Pamela
Pamela,
The ANCOVA data analysis tool has only recently been added to the Windows version of the resource pack. I hope to get a new Mac release out shortly. It will include the ANCOVA data analysis tool.
Charles
Thanks! I look forward to the new release.
Pamela