Introduction
As in ordinary ANOVA, contrasts are useful for obtaining more precise information about our data. We now show how to test the difference between two means. The key is to use the adjusted means and the correct error term.
Comparing adjusted means
To compare the adjusted means 

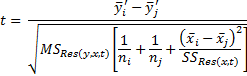
Then t ~ T(dfRes(y,x,t)). Thus, if p-value < α, then we reject the null hypothesis that 

Example
Example 1: Determine whether there is a significant difference between Method 2 and Method 4 from Example 1 of Basic Concepts of ANCOVA.
We chose these two methods since, from Figure 1 of Basic Concepts of ANCOVA, we see that these are the methods with the largest and smallest means. Figure 1 shows the calculations described above for comparing the adjusted means of Method 2 and Method 4.

Figure 1 – Comparison of Method 2 and Method 4
Here, the means for x (cells B5 and C5) and the adjusted means for y (cells B4 and C4) are found in Figure 7 of Regression Approach to ANCOVA. The formulas for the cells in column D are shown in column F. The formulas in cells D7, D8 and D11 refer to Figure 2 of Regression Approach to ANCOVA.
Since p-value = .0049 < .05 = α, we conclude there is a significant difference between Method 2 and Method 4.
Observation
As we saw when computing the adjusted means, the regression coefficient for t2 represents the difference in adjusted means between Method 2 and Method 4. Looking at Figure 5 of Regression Approach to ANCOVA, we see that the regression coefficient for t2 is 11.457 with t-stat = 3.033, the same values as those in Figure 1.
In general, another way to compare two group means is to choose one of them as the treatment which gets coded as all zeros (e.g. in Example 1 of Basic Concepts of ANCOVA, t1 = t2 = t3 = 0 for Method 4) and then look at the t-stat for the regression coefficient that corresponds to the other treatment (Method 2 in Example 1 of Basic Concepts of ANCOVA). If the p-value for this t-test is < α, then there is a significant difference between the two means.
See ANCOVA Analysis Tools for information about how to conduct Contrast analyses using the Real Statistics ANCOVA data analysis tool.
Links
Examples Workbook
Click here to download the Excel workbook with the examples described on this webpage.
References
Howell, D. C. (2010) Statistical methods for psychology (7th ed.). Wadsworth, Cengage Learning.
https://labs.la.utexas.edu/gilden/files/2016/05/Statistics-Text.pdf
Schmuller, J. (2009) Statistical analysis with Excel for dummies. Wiley
https://www.oreilly.com/library/view/statistical-analysis-with/9780470454060/
Hi, Charles,
I’ve successfully run my ANCOVA, but can’t figure out from this page how to generate the multiple comparisons. Do I have do this by hand — putting in the equations myself? I’m sorry I just can’t figure out how to generate Figure 1 for my three groups.
Thanks!
Eileen