ANCOVA Omnibus Test
Example 1: Repeat the analyses of Example 1 of ANOVA Approach to ANCOVA (ANCOVA omnibus test) and Example 1 of Tukey’s HSD for ANCOVA using the Real Statistics ANCOVA data analysis tool.
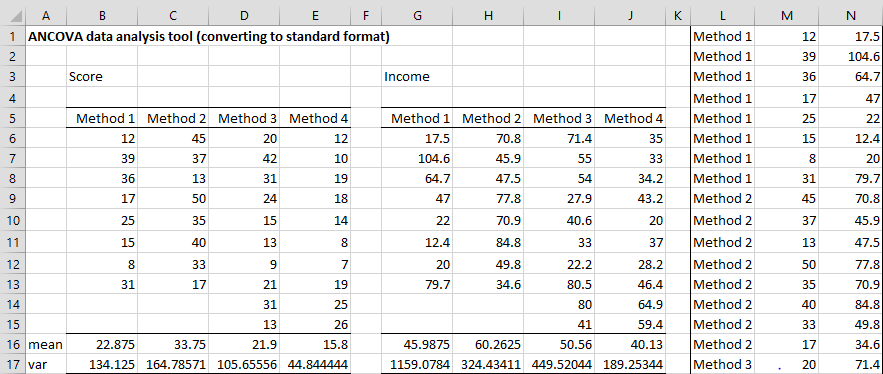
Figure 1 – Input data
Referring to the input data in Figure 1, press Ctrl-m and double-click on the Analysis of Variance option (as shown in Figure 1 of ANOVA Analysis Tool) in the main dialog box (or click on the Anova tab in the multipage interface). Select ANCOVA, press OK, and fill in the dialog box that appears as shown in Figure 2.
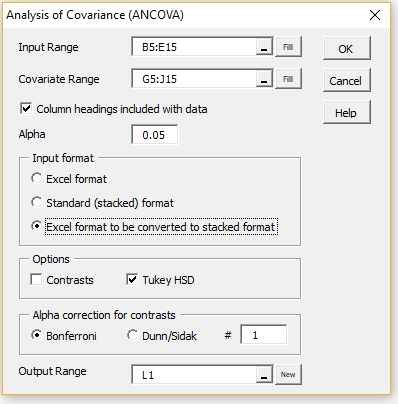
Figure 2 – ANCOVA dialog box
The output consists of the input and covariate data converted to stacked format in range L1:N36, exactly as is shown in Figure 1. This is followed by the ANCOVA report, as shown in Figure 3, and the Tukey HSD output shown in Figure 4.
We note that, although the results shown in Figure 3 are similar to those displayed in Figure 7 of ANOVA Approach to ANCOVA, there are some differences in the layout. While the output in Figure 7 of ANOVA Approach to ANCOVA reflects the ANOVA approach to ANCOVA, the output in Figure 3 reflects the regression approach to ANOVA (as described in Regression Approach to ANCOVA).
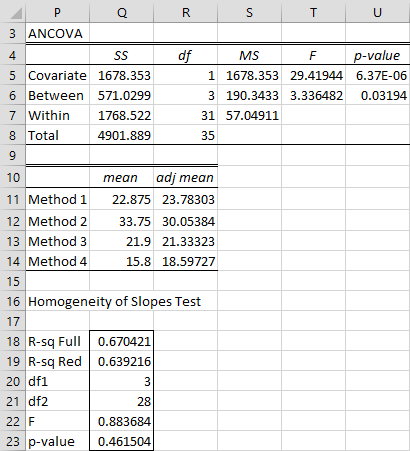
Figure 3 – ANCOVA data analysis output
Whereas the output in Figure 7 of ANOVA Approach to ANCOVA made use only of standard Excel functions, the output in Figure 3 requires use of the following Real Statistics functions.
Worksheet Functions
Real Statistics Functions: The Real Statistics Resource Pack provides the following array functions, where R1 is a range, similar to that in L1:N36 of Figure 1, in stacked format.
SSAncova(R1): outputs a column array with SSCovariate, SSBet, SSW, and SSTot
AncovaMeans(R1): outputs a k × 3 array with the group names, means, and adjusted means for each of the k treatment groups.
AncovaParallel(R1, lab): outputs a 6 × 1 array (or 6 × 2 array including a column of labels if lab = TRUE) with the values: R-square of the model which includes the interaction between the tag variables and the covariate variables, R-square of the model excluding these interactions, as well as df1, df2, F and the p-value of the equal slopes test.
Note that Figure 3 contains the array formula =SSAncova(L1:N36) in range Q5:Q7, the array formula =AncovaMeans(L1:N36) in range P11:R14, and the array formula =AncovaParallel(L1:N36,TRUE) in range P18:Q23.
Note too, that the results from the Homogeneity of Slopes Test agree with the results shown in Figure 4 of ANCOVA Assumptions.
Tukey’s HSD and Tukey-Kramer
Figure 4 shows the Tukey-Kramer analysis output from the ANCOVA data analysis tool, where the contrasts for Method 2 and Method 4 have been filled in. As you can see, the results agree with those shown in Figure 1 of Tukey’s HSD for ANCOVA.
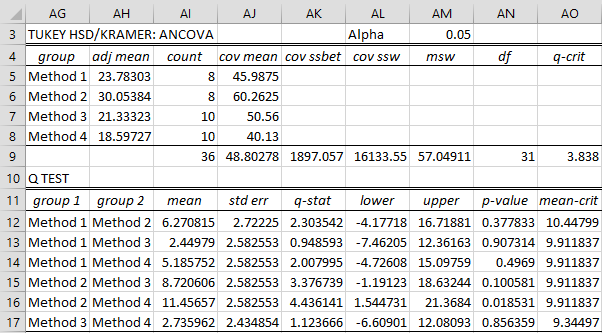
Figure 4 – Tukey HSD/Kramer data analysis
The only pairwise comparison that yields a significant result is Method 2 vs. Method 4.
Key formulas from Figure 4 are shown in Figure 5 (with reference to cells in Figure 1).

Figure 5 – Representative formulas from Figure 4
Contrasts
If we had requested Contrasts analysis, we would have checked this option in the dialog box shown in Figure 2. Alternatively, we can insert the range L1:N36 as the Input Range (leaving the Covariate Range empty), uncheck Column headings included with data, and choose the Standard (stacked) format as the Input format as well as the Contrasts option. Since we plan to perform two contrast tests, we change the # field in the Alpha correction for contrasts from 1 to 2.
The output is shown in Figure 6 (after filling in the contrast coefficients in range X5:X8).
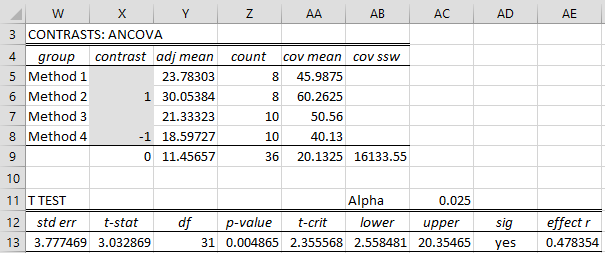
Figure 6 – Contrast data analysis
The results are similar to those in Figure 1 of Contrasts for ANCOVA. The formulas in Figure 6 are similar to those in Figure 5. The formula in cell X13 is
=SQRT(INDEX(SSAncova(L1:N36),3)/(Z9-COUNTA(W5:W8)-1)* (SUMPRODUCT(X5:X8^2,1/Z5:Z8)+AA9^2/AB9))
Note too, that since we plan on making two contrast tests, the alpha value in cell AC11 is .05/2 = .025 using a Bonferroni correction.
Links
Examples Workbook
Click here to download the Excel workbook with the examples described on this webpage.
References
Howell, D. C. (2010) Statistical methods for psychology (7th ed.). Wadsworth, Cengage Learning.
https://labs.la.utexas.edu/gilden/files/2016/05/Statistics-Text.pdf
Schmuller, J. (2009) Statistical analysis with Excel for dummies. Wiley
https://www.oreilly.com/library/view/statistical-analysis-with/9780470454060/
Hi, I’m working with a data set where the dependent variable was measured on two machines and I’m trying to determine if the linear regression lines for each machine are significantly different from one another. I figured that ANCOVA was the way to go, but I’m confused about the output results.
Specifically I’m confused about the Homogeneity of Slopes and the Tukey HSD results and what they tell me about the relationship between the two regression lines. For example if I have the Homogeneity giving a P=0.0013 but the Tukey HSD gives P=0.206 does that mean the slopes are significantly different and the Y intercepts are not? Or am I on the wrong track/have it backwards?
Thanks you for the help!
Hi Drew,
I would use the approaches described at
https://real-statistics.com/multiple-regression/comparing-slopes-and-intercepts/
https://real-statistics.com/regression/hypothesis-testing-significance-regression-line-slope/comparing-slopes-two-independent-samples/
Charles
I have two covariates. Can you software accommodate more than one and if so, how would I go about inputting that? Thx in advance
Jeff,
Currently, it accommodates only one covariate. You can use regression with more than one covariate.
Charles