Objective
In ANOVA Approach to ANCOVA, we show how to use the Real Statistics ANCOVA data analysis tool when data is in Excel format. This data analysis tool can also be used with data in stacked (i.e. standard) format. In fact, for data in stacked format, the data analysis tool also provides support for Contrasts and Tukey’s HSD test, as described in ANCOVA Analysis Tools.
Worksheet Function
Real Statistics Function: The Real Statistics Resource Pack provides the following array function to convert ANCOVA data in Excel format to stacked format.
ANCOVA1Std(R1, R2): outputs an array in stacked format for the input data in array R1 and covariate data in array R2. R1 and R2 don’t contain column headings.
Example
Example 1: Convert the data for Example 1 of Basic Concepts of ANCOVA to stacked format.
Highlight the range L3:N38, insert the array formula =Ancova1Std(B5:E15,G5:J15), and press Ctrl-Shft-Enter. If you are not sure how big to make the output, you can guess its size and then enlarge the range afterward if necessary. The first 17 rows of the output are shown in Figure 1.
Note that column M contains the input data (i.e. the data for the dependent variable) and column N contains the covariate data.
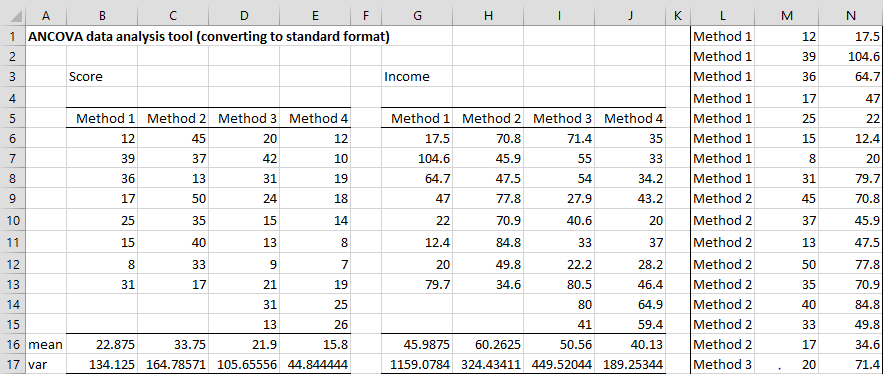
Figure 1 – Conversion of ANCOVA data to stacked format
Using the ANCOVA data analysis tool
You can also use the ANCOVA data analysis tool to convert data from Excel format to stacked format. This is demonstrated in Figure 6 of ANOVA Approach to ANCOVA. Once in stacked format, you can perform ANCOVA, Contrasts, and/or Tukey’s HSD tests.
Examples Workbook
Click here to download the Excel workbook with the examples described on this webpage.
References
Howell, D. C. (2010) Statistical methods for psychology (7th ed.). Wadsworth, Cengage Learning.
https://labs.la.utexas.edu/gilden/files/2016/05/Statistics-Text.pdf
Wikipedia (2016) Analysis of covariance
https://en.wikipedia.org/wiki/Analysis_of_covariance
Hey Charles,
I really love this toolset and think that you have done a great job. In many datasets that I look at the data is in the stacked format. I run into problems with your toolset when I begin to try to do descriptive statistics. I know you already have this selection as an option in your ANOVA tools, could there be a macro in the reformatting a data range so that running all of the tests is equally as easy.
Hello Ethan,
Some of the tools already support stacked format, but descriptive statistics doesn’t use this format. In any case you can convert the data from stacked format as follows.
Suppose that your data is contained in range A1:B50 using stacked format with column A containing labels and column B containing numerical values. Further, suppose that column A contains four different labels. If you place the formula =AnovaStd1(A1:B50) in cell D1 and press Enter (when using Excel 365) the output appearing in columns D, E, F, and G (4 columns) can be used by the Descriptive Statistics and Normality data analysis tool. If you are using another version of Excel, then you need to highlight range D1:G40 (or any range adequate in size to hold the output) and press Ctrl-Shft-Enter.
The array formula Anova1Std, Anova2Std, StdAnova1, and StdAnova2 can be used to transform data in column format to stacked format and vice versa.
These functions are described on the following webpages. They don’t just need to be used for ANOVA.
https://real-statistics.com/one-way-analysis-of-variance-anova/confidence-interval-anova/
https://real-statistics.com/two-way-anova/real-statistics-support-for-two-factor-anova/
Charles