As described in Excel Charts we can plot points in two-dimensional space using the Scatter option of Excel charting capability. We can even add labels to these points on the chart. Adding edges, i.e. lines connecting these points, is a little more difficult. To accomplish this, you can use the following Real Statistics data analysis tool.
Data Analysis Tool
Real Statistics Data Analysis Tool: The Real Statistics Resource Pack provides the Network Diagram data analysis tool to draw network diagrams for graphs G = (N, E) where nodes in N consist of points (x, y) in two-dimensional space as represented by a range with two columns (the Nodes Range) and edges in E are presented by a range with two columns (the Edges Range) whose rows are pairs of nodes (represented by the row numbers of the nodes in the Nodes Range).
Example
Example 1: Use the Network Diagram tool to draw the network diagram for the nodes in B4:C13 and edges in E4:F14 of Figure 1.
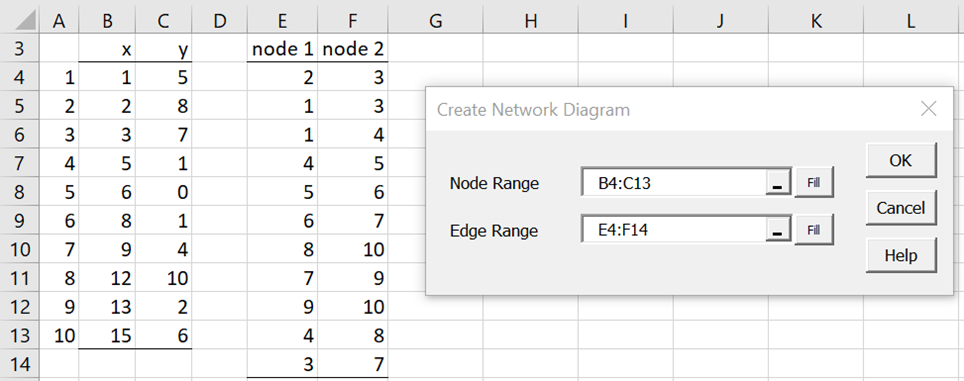
Figure 1 – Network Diagram dialog box
Press the key combination Ctrl-m and select Network Diagram (from the Desc tab if using the Multpage user interface). Fill in the dialog box that appears as shown on the right side of Figure 1.
After clicking on the OK button, the diagram in Figure 2 appears.
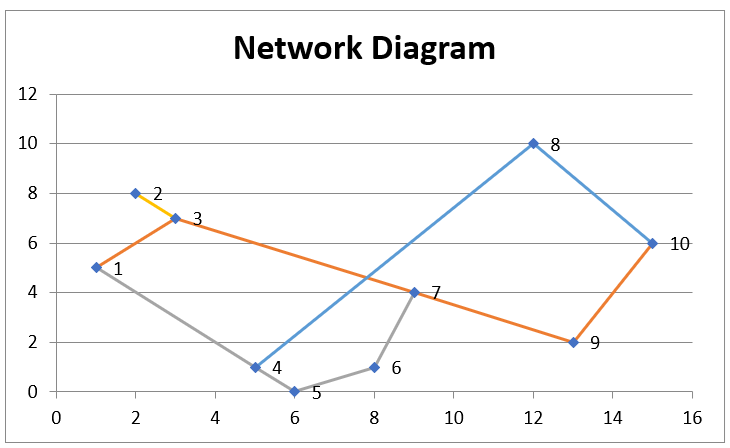
Figure 2 – Network Diagram
Minimum spanning tree
We can also use this tool to draw the minimum spanning tree for nodes that are pairs of real numbers. E.g. for Example 1, we fill in the Nodes Range in Figure 1 with B4:C15 from Figure 1 of MST for Points in r-space and we fill in the Edges Range with E4:F14 from Figure 1 of MST for Points in r-space. The resulting network diagram is shown in Figure 3.
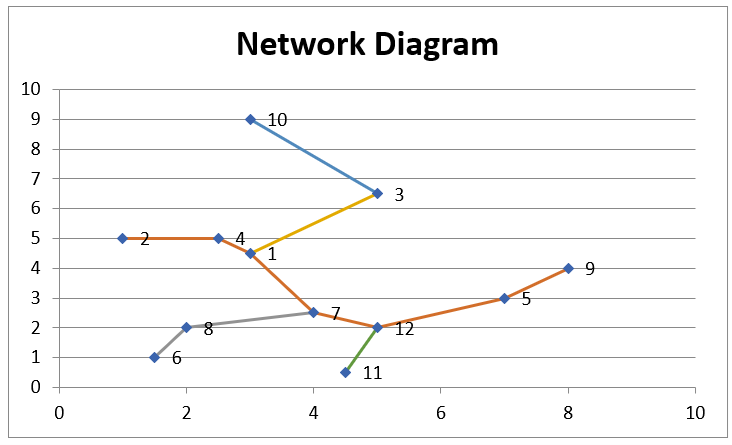
Figure 3 – Minimum spanning tree
Examples Workbook
Click here to download the Excel workbook with the examples described on this webpage.
Links
References
Cormen, T. H., Leiserson, C. E., Rivest, R. L. (1992) Introduction to algorithms. MIT Press.
https://mitpress.mit.edu/books/introduction-algorithms-third-edition
Barnwal, A. (2020) Kruskal’s minimum spanning tree algorithm, Greedy Algo-2. GeeksforGeeks
https://www.geeksforgeeks.org/kruskals-minimum-spanning-tree-algorithm-greedy-algo-2/
GeeksforGeeks (2020) Prim’s minimum spanning tree (MST), Greedy algorithm Algo-5
https://www.geeksforgeeks.org/prims-minimum-spanning-tree-mst-greedy-algo-5/
Wilson, R. J. (1996) Introduction to graph theory. 4th ed. Prentice Hall
https://webhomes.maths.ed.ac.uk/~v1ranick/papers/wilsongraph.pdf
Good afternoon Sir,
I just installed the Excel Real statistics add-ins. However the “Network analysis” tool does not appear in the “Misc” tab (after using Crtl-m shortcut), as it should be according to this explanation webpage : https://real-statistics.com/other-mathematical-topics/graph-theory/network-diagrams-in-excel/
Do you know where I could find it please ?
Matthieu
Hello Matthieu,
I apologize for the misinformation. The Network Design data analysis tool has been moved to the Desc tab. I have updated this on the website.
Charles
I am looking for the real statistics add on for excel. I want to replicate the example on the website.
Thanks
Hi Carrae,
Please go to https://real-statistics.com/free-download/real-statistics-resource-pack/
Charles
Good morning sir,
In my Excel Real statistics add-ins, either MST functions and network analysis tool in Real statistics toolpack are missing.
Hi Alex,
Did you find the Network Diagram data analysis tool on the Misc tab?
Are you able to use the MSTKruskal and MSTPrim worksheet functions?
If you still can’t access any of these, what do you see when you enter the formula =VER() in any cell on an Excel spreadsheet?
Charles