Worksheet Functions
Real Statistics Functions: The following functions are provided in the Real Statistics Resource Pack:
CRONALPHA(R1, k) = Cronbach’s alpha for the data in range R1 if k = 0 (default) and Cronbach’s alpha with the kth item (i.e. column) removed if k > 0
CALPHA(R1): array function which returns a row of Cronbach’s alpha for R1 with each item removed
Thus, for the data in Example 1 of Cronbach’s Alpha Basic Concepts, we can obtain the results shown in Figures 1 and 3 of Cronbach’s Alpha Basic Concepts using CRONALPHA(B4:L15) = .738019 and CRONALPHA(B4:L15, 1) = .76321. Also, the formula CALPHA(B4:L15) can be used to produce the results shown in range B43:L43 of Figure 3 of Cronbach’s Alpha Basic Concepts.
Example
Example 1: Calculate Cronbach’s alpha for a 10-question questionnaire with Likert scores between 1 and 7 based on the 15-person sample shown in Figure 1.

Figure 1 – Calculation of Cronbach’s alpha for Example 1
As you can see from Figure 1, Cronbach’s alpha is 0.59172, a little below the generally acceptable range. We get the same answer by using the supplemental formula in the Real Statistics Resource Pack, namely CRONALPHA(B4:K18) = 0.59172.
Data Analysis Tool
Real Statistics Data Analysis Tool: The Real Statistics Resource Pack provides the Internal Consistency Reliability data analysis tool which can be used to calculate Cronbach’s alpha.
We now show how to calculate Cronbach’s alpha for Example 1 using the Internal Consistency Reliability data analysis tool. Start, as usual, by pressing Ctrl-m, and then choose the Internal Consistency Reliability option from the Corr tab, as shown in Figure 2.
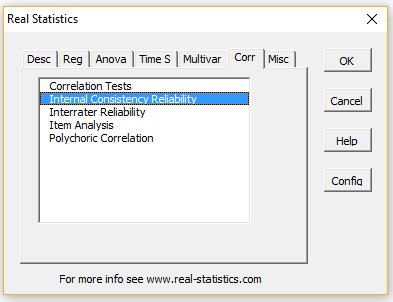
Figure 2 – Corr tab (multipage interface)
If you are using the original user interface, then after pressing Ctrl-m, choose the Reliability option from the main menu and then double-click on the Internal Consistency Reliability option from the dialog box that appears, as shown in Figure 3.
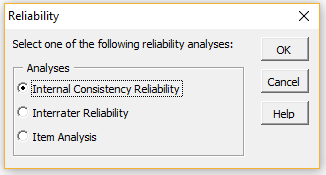
Figure 3 – Reliability dialog box
Now, in either case, fill in the dialog box that appears as shown in Figure 4.

Figure 4 – Internal Consistency Reliability dialog box
Output
The output is shown in Figure 5. Cell M3 displays Cronbach’s alpha, while Cronbach’s alpha values with one question removed are shown in range M8:V8, which is the same as the output from =CALPHA(B4:K18).

Figure 5 – Cronbach’s alpha option of Reliability data analysis tool
Examples Workbook
Click here to download the Excel workbook with the examples described on this webpage.
Links
References
Tavakol, M., Dennick, R. (2011) Making sense of Cronbach’s alpha. International Journal of Medical Education
https://www.ijme.net/archive/2/cronbachs-alpha.pdf
Gliem, J. A., Gliem, R. R. (2004) Calculating, interpreting, and reporting Cronbach’s alpha reliability coefficient for Likert-type scales
https://scholarworks.indianapolis.iu.edu/server/api/core/bitstreams/976cec6a-914f-4e49-84b2-f658d5b26ff9/content
Newsom, J. (2017) Empirical estimates of reliability: Cronbach’s alpha
https://web.pdx.edu/~newsomj/pmclass/empirical%20estimates%20of%20reliability.pdf