Basic Concepts
Guttman published six measures of reliability based on the split-half method. We will consider his lambda 4 measurement, namely
![]()
where h1 represents the partial scores from the first half, h2 represents the partial scores from the second half, and t represents the total scores. Thus, each split-half produces a different value of λ.
Odd/Even Example
Example 1: Repeat Example 2 of Split-half Basic Concepts using Guttman’s lambda 4 for the odd/even split.
The result is shown in Figure 1.

Figure 1 – Guttman’s Lambda 4
Definition
Guttman’s reliability is defined as
λmax = max {λ: all possible split halves}
It turns out that Guttman’s reliability is a pretty good measure of reliability and produces a higher value than Cronbach’s alpha, which is the most commonly used measure (see Cronbach’s Alpha. Whereas Cronbach’s alpha tends to under-estimate the true reliability, Guttman’s reliability may over-estimate reliability when the sample size is small or there are a large number of items.
Note that if there are 2k items (an even number), there are C(2k,k)/2 different split-half partitions of the 2k items. If there are 2k+1 items (odd number), there are C(2k+1,k) different splits.
Example with many partitions
Example 2: Find Guttman’s reliability for the data in Example 2 of Split-half Basic Concepts.
Since there are 10 questions in the questionnaire, there are C(10,5)/2 = 126 possible split-half partitions. We list these partitions in column N of Figure 25.1.6. E.g. the value “0001110110” in cell N20 signifies that questions Q1, Q2, Q3, Q7, and Q10 go in one half and the remaining questions in the other half.
The covariance corresponding to each partition is shown in column O, and the corresponding Guttman’s lambda values are shown in column P (e.g. the formula in cell P3 is =4*O3/L$20), where cell L20 contains the formula =VAR.S(L4:L18).
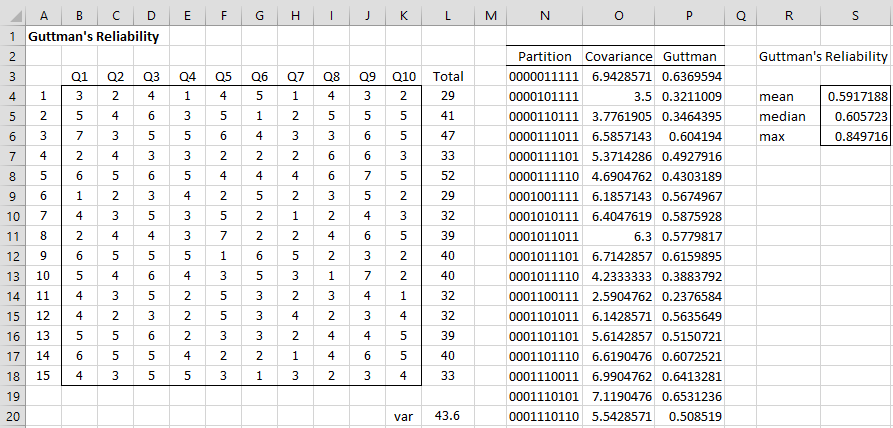
Figure 2 – Guttman’s reliability
Guttman’s reliability is .849716 (cell S6), as calculated by the formula =MAX(P3:P128). In addition, the mean and median Guttman’s lambda values are shown in cells S4 and S5.
Worksheet Functions
Real Statistics Functions: The Real Statistics Resource Pack contains the following functions:
GUTTMAN_SPLIT(R1, s) = Guttman’s lambda for the data in range R1 based on the split described by string s.
GUTTMAN(R1, iter) = the Guttman’s reliability measure for the data in range R1, i.e. the maximum Guttman’s lambda based on all possible splits; iter defaults to zero, in which case all possible partitions are considered. See below for a description of the case where iter ≠ 0.
String s consists of 0’s and 1’s where each character in the string corresponds to one column in R1 (thus, the length of s must be equal to the number of columns in R1). E.g. the string s = “101010” represents the split-half where the odd-numbered questions are in one half, and the even-numbered questions are in the other half.
Split and partition functions
Split functions
The following functions support the Guttman functions described above.
INIT_SPLIT(n, m) = returns a string of length n consisting of m 0’s followed by n–m 1’s. If omitted m defaults to n/2.
NEXT_SPLIT(s) = returns the string representing the next split after the split represented by s.
RAND_SPLIT(n, m) = returns a random string of length n consisting of m 0’s and n–m 1’s. If omitted, m defaults to n/2.
COV_SPLIT(R1, s) = sample covariance for the data in range R1 based on the split described by string s.
CORR_SPLIT(R1, s) = correlation for the data in range R1 based on the split described by string s.
Note that the INIT_SPLIT and NEXT_SPLIT functions can be used to generate a series of strings that represent split halves of a specific length: e.g. the following list of strings of length four: 0011, 0101, 0110, 1001, 1010, 1100.
Partition functions
The Real Statistics Resource Pack also provides the following functions, which are similar to the split-half functions described above, although not used with the split-half method.
INIT_PARTITION(n) = returns a string consisting of n 0’s
NEXT_PARTITION(s) = returns the string representing the next partition after the partition represented by s.
RAND_PARTITION(n) = returns a random string of length n consisting of 0’s and 1’s.
Note that the INIT_PARTITION and NEXT_PARTITION functions can be used to generate a series of strings which represent partitions of a specific length where the number of 0’s and 1’s can be of any length: e.g. the following list of strings of length three: 000, 001, 010, 011, 100, 101, 110, 111.
Example
Note that for Example 1, we used the formula INIT_SPLIT(COUNTA(B3:K3)) in cell N3 and NEXT_SPLIT(N3) in cell N4 of Figure 2. We then highlighted the range N4:N128 and pressed Ctrl-D. Next, we placed the formula =COV_SPLIT(B4:K18,N3) in cell O3, highlighted the range O3:O128, and pressed Ctrl-D. We could also have used the formula GUTTMAN(B4:K18) to calculate the value shown in cell S6.
Simulation
Note that the number of possible splits grows exponentially. With 20 questions, there are 92,378 possible splits, with 25 questions, 2,600,150 splits, and with 30 questions 77,558,760 splits.
When the number of possible partitions gets too large, it is impractical to generate all possible partitions. In such cases, we can generate a random split-half partition and calculate Guttman’s lambda value for that split. We can then repeatedly swap columns between the two split halves in an attempt to maximize Guttman’s lambda value. We can do this for iter such random split halves and calculate GUTTMAN(R1, iter) as the largest Guttman’s lambda value of these.
When swapping columns, it is straightforward to calculate the covariance of the new split (and therefore for Guttman’s lambda value) as described next.
If x = x1, …, xn is the data (represented as n column vectors) and s is a string of zeros and ones representing a split-half partition. Let y = the sum of xi vectors in the half represented by 0 in s, and z = the sum of the xi vectors in the half represented by 1 in s. If we want to exchange columns i and j in s where the ith character in s is 0 and the jth character in s is 1, then

where
Alternative approach
Another approach to calculating an approximate Guttman’s lambda value is to simply calculate iter number of random split-half partitions and calculate GUTTMAN(R1, -iter) as the largest Guttman’s lambda value of these (note the negative sign in the second argument).
Examples Workbook
Click here to download the Excel workbook with the examples described on this webpage.
Links
References
Nydick, S.W. (2012) The relationship between Spearman-Brown and Cronbach’s alpha
https://swnydick.github.io/assets/reports/Spearman_Brown_and_Coefficient_Alpha.pdf
Benton, T. (2013) An empirical assessment of Guttman’s Lambda 4 reliability coefficient. International Meeting of the Psychometric Society, Arnhem, July 2013
https://www.cambridgeassessment.org.uk/Images/141299-an-empirical-assessment-of-guttman-s-lambda-4-reliability-coefficient.pdf
I love your tool. How can I calculate confidence intervals for a Guttman Split-Half Reliability coefficient?
Hello Marc,
Thanks for your kind words about the Real Statistics tool.
I don’t know of an analytic approach to estimating confidence intervals for the Guttman Split-Half Reliability coefficient.
Perhaps you can use bootstrapping for this purpose, but I have not investigated it. See
Resampling
Charles