Using Newton’s Method with Summary Data
Before turning our attention back to Example 1 of Basic Concepts of Logistic Regression, we first give some useful background.
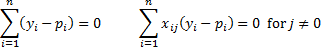
Property 1: The maximum of the log-likelihood statistic (from Definition 5 of Basic Concepts of Logistic Regression) occurs when the following k + 1 equations are satisfied.
 Click here for a proof of Property 1, which uses calculus.
Newton’s Method
Thus, to find the values of the coordinates bi we need to solve the equations
We can do this iteratively using Newton’s method (see Definition 2 of Newton’s Method and Property 2 of Newton’s Method) as described in Property 2.
Property 2: Let B = [bj] be the (k+1) × 1 column vector of logistic regression coefficients, let Y = [yi] be the n × 1 column vector of observed outcomes of the dependent variable, let X be the n × (k+1) design matrix (see Definition 3 of Least Squares Method for Multiple Regression), let P = [pi] be the n × 1 column vector of predicted values of success and V = [vij] be the n × n diagonal matrix where vii = pi (1 – pi) on the main diagonal and zeros elsewhere. Then if B0 is an initial guess of B and for all m we define the following iteration
![]()
then for m sufficiently large B ≈ Bm, and so Bm is a reasonable estimate of the coefficient vector.
Click here for a proof of Property 2, which uses calculus.
Summary Data
If we group the data as we did in Example 1 of Basic Concepts of Logistic Regression (i.e. summary data), then Property 1 takes the form
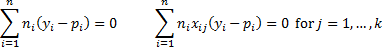 where n = the number of groups (instead of the sample size) and ni = the number of observations in group i.
Property 2 also holds where Y = [yi] is the n × 1 column vector of summarized observed outcomes of the dependent variable, X is the corresponding n × (k+1) design matrix, P = [pi] is the n × 1 column vector of predicted values of success and V = [vij] is the n × n matrix where vii = ni pi (1 – pi) on the main diagonal and vij = 0 when i ≠ j.
Example
Example 1 (using Newton’s Method): We now return to the problem of finding the coefficients a and b for Example 1 of Basic Concepts of Logistic Regression using Newton’s Method.
We apply Newton’s method to find the coefficients as described in Figure 1. The method converges in only 4 iterations with the values a = 4.47665 and b = -0.0072.

Figure 1 – Finding regression coefficients using Newton’s method
The regression equation is therefore logit(p) = 4.47665 – 0.0072x.
We can get the same result using the Logistic Regression data analysis tool as described in Finding Logistic Regression Coefficients using Solver, except that this time we check the Using Newton method option in the Logistic Regression dialog box (see Figure 4 of Finding Logistic Regression Coefficients using Solver or Figure 3 below).
Using Newton’s Method with Raw Data
Example 2: A study was made as to whether environmental temperature or immersion in water of the hatching egg had an effect on the gender of a particular type of small reptile. The table in Figure 2 shows the temperature (in degrees Celsius) and immersion in water (0 = no and 1 = yes) of the 49 eggs that resulted in a live birth as well as the sex of the reptile that hatched. Determine the odds that a female will be born if the temperature is 23 degrees with the egg immersed in water vs. not immersed in water.

Figure 2 – Data for Example 1
We use the Logistic and Probit Regression data analysis tool, selecting the Logistic, Raw data, and Newton Method options as shown in Figure 3.
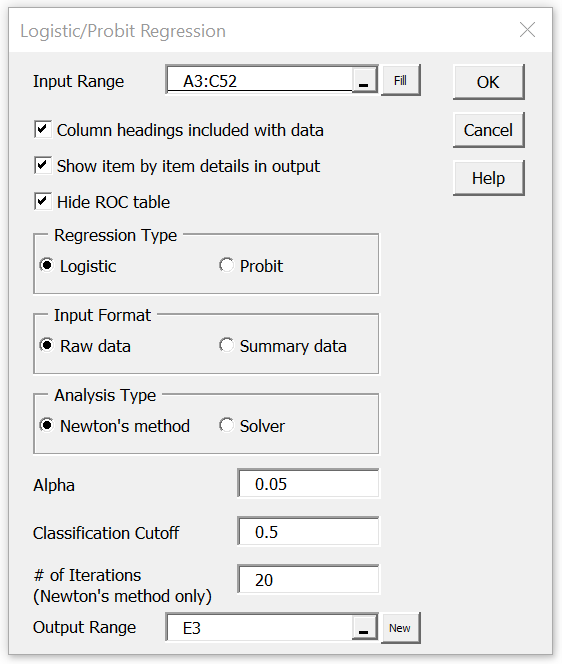
Figure 3 – Logistic Regression dialog box for Example 2
After pressing the OK button we obtain the output displayed in Figure 4.
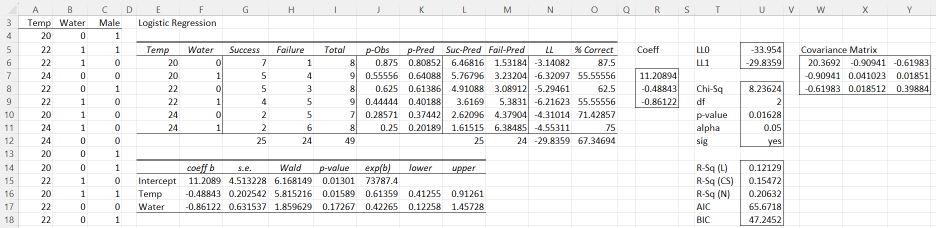
Figure 4 – Output from Logistic Regression data analysis tool
Here we only show the first 15 elements in the sample, although the full sample is contained in range A4:C52. Note that in the raw data option, the Input Range (range A4:C52) consists of one column for each independent variable (Temp and Water for this example) and a final column only containing the values 0 or 1, where 1 indicates “success” (Male in this case) and 0 indicates “failure” (Female in this case). Please don’t read any gender discrimination into these choices: we would get the same result if we chose Female to be success and Male to be failure.
The model indicates that to predict the probability that a reptile will be male you can use the following formula:
![]() We can now obtain the desired results as shown in Figure 5 by copying any formula for p-Pred from Figure 4 and making a minor modification.
We can now obtain the desired results as shown in Figure 5 by copying any formula for p-Pred from Figure 4 and making a minor modification.

Figure 5 − Predicted values
Here we copied the formula from cell K6 into cells G29 and G30. The formula that now appears in cell G29 will be =1/(1+EXP(-$R$7-MMULT(A29:B29,$R$8:$R$9))). You just need to change A29:B29 to E29:F29 (where the values of Temp and Water actually appear). The resulting formula
1/(1+EXP(-$R$7-MMULT(E29:F29,$R$8:$R$9)))
will give the result shown in Figure 5.
In Real Statistics Functions for Logistic Regression we show an easier way of finding the predicted values.
Caveat
The approach described above for performing logistic regression with input in the form of raw data works well for up to 65,500 rows of data. When the input data contains more than 65,500 rows, you can still use the Logistic Regression data analysis tool, but you need to uncheck the Show summary in output option (see Figure 3).
See Real Statistics Functions for Logistic Regression for how to perform logistic regression including summaries when there are more than 65,500 rows of raw data.
Examples Workbook
Click here to download the Excel workbook with the examples described on this webpage.
References
Shalizi, C. (2009) Logistic regression and Newon’s method. Data mining class
https://www.stat.cmu.edu/~cshalizi/350/lectures/26/lecture-26.pdf
Hi Charles,
Huge thanks for this website. I have this huge data of about 150K records with about 9 variables and after downloading and following the steps for running logistics regression, I got a Compile Error in Hidden Module” Which I believe is because the code was protected. I remember seeing a window requesting “realstats password” when launching the code. Is there a way around this ?
See Password Prompt
The problem is probably not the size of your data.
Charles
Hi Charles
Thank you for your great website & tools.
This regression works fine for cases where there are more than 2 outcomes for the independent variable (like in the Temp only model). But when I try to do the Water only model, I get an error message saying “input range must have at least as many data rows as columns”.
I am using version “6.2 Excel 2016/2019/365 Mac”
Regards
Hi Walter,
I am not having any problem doing this. If you email me an Excel file with your data, I will try to figure out what is going wrong.
Charles
Charles, Hello again
1) for the IND variables do you have to group them together or can you use each value independently?
2) Can you give me the excel version for the covariance matrix W6-Y8 for the hatching egg example if I use independent row for each dataset, I got the MINVERSE_MMULT_TRANSPOSE_DESIGN formula working for the previous REM example but not sure how to deal with 2 or more IND variables
Hi Charles,
I have read the papers referred by you. There is a measure of relative importance of predictor variables in logistic regression model. The measure is called “Adequacy”.
Let me refer to the example in fig 4 above. Assuming that both water and temp are significant (in this particular example, water is not significant), I want to calculate the adequacy of the temp and water predictors.
I have run a water-only model and calculated the Adequacy for the predictor variable water in Fig.4 above. The LL for water-only model is -33.1075. The LLo (Intercept-only model is -33.954. The LL for full model (with temp and water) is -29.8359.
Adequacy for water = [2(-33.954)-2(-33.1075)]/[2(-33.954)-2*(-29.8359)]
= 0.205556
Adequacy for temp = [2(-33.954)-2(-30.7955)]/[2(-33.954)-2*(-29.8359)]
= 0.76698
Are the calculations correct?
As adequacy for temp is larger than water, can I say that temp is more important predictor variable than water?
Hello Dennis,
I am not familiar with this measure of adequacy. Can you provide a reference that describes this measure?
Charles
Dear Charles,
The Real Statistics Resource Addin is certainly wonderful.
I have built a Binary Logistic Regression Model for one independent binary, dichotomous variable and six dependent variables. The coefficients of 4 dependent variables are significant (p-value < 0.05). I want to evaluate the relative strengths of the relationship between the independent variable and the 4 variables.
How can I do so?
In multiple linear regression, I can do it in four ways:
1. Standardize the dependent variables and run the model again. Compare the coefficients.
2. Remove 1 dependent variable and re-run the model to see how much the r-square value is reduced. Repeat the same procedure for the other variables and compare the reductions of the r-square values.
3. To decompose the r-square by Shapley-owen decomposition,
https://real-statistics.com/multiple-regression/shapley-owen-decomposition/
4. To calculate the partial correlation coefficients of the independent variables.
Can I apply these 4 ways in binary logistic regression?
Hi Dennis,
Here are some webpages that may be useful to you in answering your question:
https://journals.sagepub.com/doi/abs/10.1177/1094428109341993?journalCode=orma
https://digitalcommons.wayne.edu/cgi/viewcontent.cgi?article=1419&context=jmasm
https://stats.stackexchange.com/questions/106344/how-to-quantify-the-relative-variable-importance-in-logistic-regression-in-terms
Charles
Hi Charles,
Thank you for your quick response.
I have found a pseudo partial correlation formula for one of the reference papers you provided. It reads:
The pseudo partial correlation is defined as r = ± the square root of ((Wi‐2K)/‐2LL(0)), where Wi is the Wald chi‐square statistic for predictor i, (βi/SEβi)2, ‐2LL(0) is ‐2 times the log likelihood of a model with only an intercept term, and K is the degrees of freedom for predictor i
I have used the formula to calculate the pseudo partial correlations for temp and water in figure 4 above.
temp, = sqrt((5.81522-2K)/2(33.954))
what is the K for temp?
water, = sqrt((1.85963-2K)/2(33.954))
What is the K for water?
Hello Dennis,
I have not read these papers, but I can say that df = the # of predictors, and so for the specific problem since temp-only model has only one predictor (i.e. temp), df = 1, and similarly df = 1 for the water-only model.
Charles
Dear Charles,
I have found your website very useful for doing some statistical analyses using Excel. If I would not like to use RealStats software, is it possible to calculate logistic regression coefficients with the use of Newton’s method, just by using common Excel formulas? If so, where on your website can I look for Excel equations to calculate them? Right now I am working on 2 x 300 cases groups with up to 3 independent (explaining) variables.
Many thanks in advance
Cezary
See https://real-statistics.com/logistic-regression/finding-logistic-regression-coefficients-using-newtons-method/logistic-regression-using-newtons-method-detailed/
Charles
Dear Charles,
I have found your website very useful for doing some statistical analyses using Excel. If I would not like to use RealStats software, is it possible to calculate logistic regression coefficients with the use of Newton’s method, just by using common Excel formulas? If so, where on your website can I look for Excel equations to calculate them? Right now I am working on 2 x 300 cases groups with up to 3 independent (explaining) variables.
Many thanks in advance
Cezary
Cezary,
On this webpage.
Charles
Hi Charles,
I’m using this RealStat Add-in to compute logit. However, one of my dependent variables “Age” has missing data, and this algorithm filled in some of the missing data with negative numbers. Since Age > 0, is there anyway I can make adjustments?
Mukden,
If Age has missing data, the RealStats add-in should give you an error message. Please explain what you mean by “this algorithm filled in some missing data…”
In any case, if you have missing data, you can eliminate any row with missing data (the usual approach) or use some technique to impute the missing data. See the following webpage:
https://real-statistics.com/handling-missing-data/
Charles
Hi Charles,
Looking at Figure 1, I was wondering if you could tell me what the design matrix would be in order to get the covariance matrix shown in iteration 0. Also directly affects what matrix V would be, so any insight onto that would also be appreciated.
Also, how is the iteration matrix formed?
Thanks,
David
David,
The design matrix that actually achieves the covariance matrix shown in range J9:K10 after zero iterations is the 10 x 2 matrix with ones in the first column and the values in the range E4:E13 in the second column.
The array formula used to calculate the covariance matrix for iteration 0 is
=MINVERSE(MMULT(TRANSPOSE(DESIGN(E4:E13)),MMULT(DIAGONAL(G4:G13*(1-G4:G13)*($B$4:$B$13+$C$4:$C$13)),DESIGN(E4:E13))))
Charles
Dear Charles,
I want to deal with the data that you given above: Rems, Survived, and dead. How ever, after I inserted the data in RealStats-2003 pac, a message that said “you should enter 0 and 1 in the last column” appeared. How can I run this pac?
Thanks.
Sisay,
The last column must contain only 0’s and 1’s if you use the Raw data option. This is not the case for the Summary data option. Probably you just need to choose the Summary option instead of the Raw option.
Charles
Dear Charles,
Eureka! Many thanks indeed! Education is sharing
I will keep in touch
How can I solve V which is covariance matrix?
Sisay,
Are you referring to the V in Property 2? If so V = [v_ij] be the n × n diagonal matrix where v_ii = p_i (1 – p_i) on the main diagonal and zeros elsewhere.
Charles
Thanks, Charles.
1. Specifically I want to know how you get covariance matrix which is
0.03483 -6.00E-05
-6.00E-05 1.10E-07 in your survival analysis example at iteration 0
2. Do you mind if you elaborate me the matrix of V=[v_ii]=p_i(1-p_i) in figures.
Thanks again
Sisay,
See Property 1 on the following webpage:
https://real-statistics.com/logistic-regression/significance-testing-logistic-regression-coefficients/
Charles
Hi Charles,
Thanks so much for all the instruction in this website! It’s been a life saver for me over the past few months.
One quick question: for categorical independent variables, is 1 or 0 the referent group for interpreting exp(b)? E.g. using your example, Figure 4, would you say that, after adjusting for temperature, the odds of being hatched male are 0.4 (95% CI, 0.1-1.5) times as likely for an egg born in water (water=1) compared to an egg born out of water (water=0)? Or is it that the odds of being hatched male are 0.4 (95%CI, 0.1-1.5) times as likely for an egg born out of water (water=0) compared to an egg born in water (water=1)?
Thanks again!
Rachael
Rachel,
The ratio Odds(0)/Odds(1) = exp(b) = .42265. Thus, the odds of a male birth for an egg in water = .42265 times the odds of a male birth for an egg not in water
For more information, see the comment below Figure 3 on the following webpage:
https://real-statistics.com/logistic-regression/finding-logistic-regression-coefficients-using-excels-solver/
Charles
Hi Charles! This page of yours is extremely helpful, I can’t thank you enough for it really helped me understand logistic regression better.
I’m trying to apply the binary logistic regression test on my data where I have dummy coded independent variables, however, there are errors on the result when I applied it on all the variables. But when I tried to do it with fewer variables, it worked. I wonder what’s the problem.
It is likely that there isn’t any problem, simply that one set of data is a fit for logistic regression and the other isn’t.
Charles
Hi, Charles! Thank you for this very insightful site of yours, it helped me tremendously! I would like to ask, with the result, what value should I look for if I’ want to determine whether the tested independent variables are significant? And, are the tests for multicollinearity and interaction already included in the logistic regression test? Your reply will be deeply appreciated. Thanks!
Justin Radcliffe
Justin,
If you look at the p
Justin,
1. If you look at Figure 4, you will see that for each coefficient the p-value is given. This can be used to determine whether that coefficient is significant (i.e. the coefficient for the corresponding variable is significantly different from zero). If the coefficient is not significant then that variable does not contribute significantly to the model (in the presence of the other variables).
2. While the multicollinearity test is not included in the logistic regression output, it is identical to that used for linear regression, and so you can use the VIF function to test for it. If there is 100% multicollinearity then the logistic regression model will not converge and you will see error values in the output.
3. You can model interaction in the same way as you do for linear regression, namely if you are interested in the interaction between variables x1 and x2, then you need to include x1*x2 in the model (i.e. a column whose values are the (pairwise) product of the data in the columns for x1 and x2.
Charles
Thank you very much, Charles! Your reply is of big help!
Hi Mr. Charles. I have a problem to understand how this newton’s method work for my data for MNL models. for example : I have 10 respondent and each respondent has a three alternative options (1 = Bus; 2=auto;3=motor). and of course all respondents has a three different time travels (travel times is independent variable). and from my observations I have what respondent choose from three alternative that I explain above.
I couldn’t follow your example above and adjusting my data.
With three possible outcomes, you should consider using multinomial logistic regression instead of (binary) logistic regression. Please look at the webpage Multinomial Logistic Regression.
Charles
Hi Charles,
Your excel add in has helped me a lot in my project.
I was wondering, whether its possible or not, to have both categorical and interval/ratio (non categorical) data in the input, and can your logistic regression model be used with such a data.
My project is building a prediction model, based on inputs like Modification type (categorical), FICO score (continuous data), and so on.
Thanks,
Vatsal
You can use either type of data. If you use categorical data (with more than 2 categories) you need to decide whether to use tag coding (aka dummy coding). You can do this yourself as described elsewhere on the website or you can have the software do this for you. The dummy coding capability is available from the linear regression data analysis tool. See the webpage Categorical Coding.
Just use that tool to do the coding and then switch to the logistic regression tool to do the actual analysis.
Charles
Thanks for the swift response.
However, my model requires both, categorical as well as continuous data as input, and the output is binary.
Let me tell you my project: design a default rate prediction model, based on certain parameters. I have loan level data with me, in which there are both categorical and continous data for each loan number, and the output is, whether the loan defaulted or not (0 or 1, hence binary output).
I tried using the logistic regression capability of the add-in but the output wasnt what I desired, since it mapped each categorical data point with each individual continuous data point.
The example in the link (Categorical coding) is of linear regression. Can this be done in logistic regression as well?
Thanks again!
Hi Charles,
Your explanation regarding logistic regression was very helpful. However, I have a small doubt about categorical variables. When doing logistic regression with categorical (more than 2 values possible such as dept. 1, 2, 3) independent variable, how do I interpret the odds ratio (exp(b) in this tool) of such a categorical variable?
Thnaks
You should use a tag coding with more than 2 possible values for a categorical variable (this can be done manually or by first using categorical coding capability found in the Linear Regression data analysis tool). In this case you can have odd ratios (e.g. Dept 1 vs. Dept 3).
Charles
Please sir, can you help me with the excel template for a Cox Proportional Hazard Model to complete my theses. Indeed am doing magic with your template at my work place as a statistics officer. My regards to you and your support team @ real-statistics.
THANKS!!
I plan on adding survival analysis capabilities later this year, but for now I will put the Cox Proportional Hazard Model on my list of future enhancements.
Charles
Hi Charles,
I have used Logistic Regression Coefficients using Newton’s Method for my data. unfortunately, I couldn’t read and understand the results. Is there a link that explains the basics of logistic regression output.
Thanks,
Hi Shosho,
Perhaps the following webpage will help:
https://real-statistics.com/logistic-regression/finding-logistic-regression-coefficients-using-excels-solver/
Charles
Hi Charles,
I want to use the Newton’s method,but I can’t get the intercept and slope when I use the 19 independent variables. I can only get the coefficient with one independent variable at each time.
Why I can’t apply all the independent variables for the regression?
Yeva,
Please send me your worksheet and I will look at it.
Charles
Hi Yeva,
I have looked at the spreadsheet you sent me. There is no problem with the number of variables. The problem is the number of rows of data.
The Logistic Regression data analysis tool uses the LogitSummary function to convert raw data (as in your input) to summary format.There is a 65,500 limit for this function (and for similar functions in Excel). I have created a work-around to handle more than 65,500 rows of raw data using the LogitMatches function. This is described on the webpage https://real-statistics.com/logistic-regression/real-statistics-functions-logistic-regression/
Charles
Hi Charles,
I am a student from China, I am now learning how to do logistic regression in EXCEL.Then I find your website, I have read your all papers about the logistic regression ,but I still have some questions.
I have 19 kinds of independent variables and 1 dependent variables.I have used to ways to run the data, but I can’t find the answers….
Can you help me to find the reasons? Thanks very much.
Looking forward for your reply,
Yeva
Hi Yeva,
Which questions do you have?
Charles
Hi Charles,
Would it be possible to have the excel version of figure one?
Thanks,
Muzz
Hi Muzz,
All the examples on the website can be downloaded, including the one in the referenced figure. See the webpage https://real-statistics.com/free-download/real-statistics-examples-workbook/ for more details.
Charles
When i run data on this tool it shows an error Compile error in hidden module.Could you please help me on this.
Kind Regards
Mohit
Mohit,
Which version of the Real Statistics Resource pack are you using. You can find this out by entering =VER() in any cell?
Which version of Excel are you using?
Charles
Hi Charles,
So glad to find this helpful blog. However I have a question regarding the value of water immersion. From my understanding this value is independent variable. If I insert my independent variable to any number rather than 0,1 I got error. My question is, is it a must that this column be 0 or 1 only?
Thanks
Hi Raseeda,
An independent variable such as Water Immersion can take any value, not just 0 and 1. Note, however, that if you change an existing 0 or 1 to some other number you will increase the number of rows in the output. This won’t happen automatically and so the output will be incorrect. To resolve this problem you need to rerun the data analysis and the error should go away. If not, please send me the data you are using and I will try to see what the problem is.
Charles