Wald statistic
Definition 1: For any logistic regression coefficient b whose standard error is seb, the Wald statistic is given by the formula
Wald = b/seb
Since the Wald statistic is approximately normal, by Property 3 of Chi-Square Distribution, Wald2 is approximately chi-square, and, in fact, Wald2 ~ χ2(df). Here df = k – k0 where k = the number of parameters (i.e. the number of coefficients) in the full model and k0 = the number of parameters in a reduced model (i.e. the model with some variables removed). In testing whether coordinate b = 0, it follows that df = k – (k–1) = 1 , and so the test is Wald2 ~ χ2(1).
Key Property
Property 1: The covariance matrix S for the coefficient matrix B is given by the matrix formula
![]()
where X is the n × (k+1) design matrix (as described in Definition 1 of Multiple Regression using Matrices)

and V = [vij] is the r × r diagonal matrix whose diagonal elements are vii = ni pi (1–pi), where ni = the number of observations in group i and pi = the probability of success predicted by the model for elements in group i. Groups correspond to the rows of matrix X and consist of the various combinations of values of the independent variables.
Note that S = (XTW)-1 where W is X with each element in the ith row of X multiplied by vii.
The standard errors of the logistic regression coefficients consist of the square root of the entries on the diagonal of the covariance matrix in Property 1.
Example
Example 1 (Coefficients): We now turn our attention to the coefficient table given in range E18:L20 of Figure 6 of Finding Logistic Regression Coefficients using Solver (repeated in Figure 1 below).
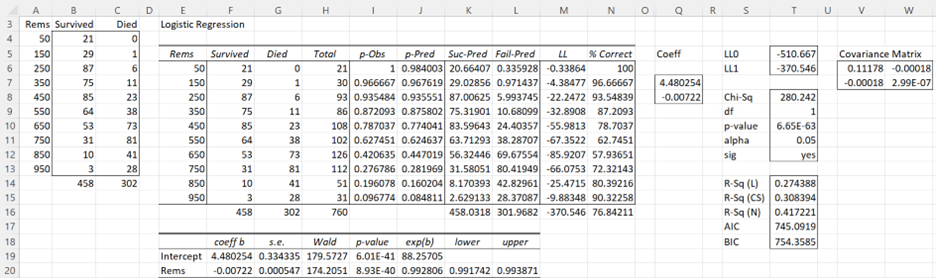
Figure 1 – Output from Logistic Regression tool
Using Property 1 we calculate the covariance matrix S (range V6:W7) for the coefficient matrix B via the formula
=MINVERSE(MMULT(TRANSPOSE(DESIGN(E6:E15)), MMULT(DIAGONAL(J6:J15*(1-J6:J15)*H6:H15),DESIGN(E6:E15))))
Actually, for computational reasons it is better to use the following equivalent array formula:
=MINVERSE(MMULT(TRANSPOSE(DESIGN(E6:E15)),J6:J15*(1-J6:J15)*H6:H15* DESIGN(E6:E15)))
The formulas used to calculate the values for the Rems coefficient (row 20) are given in Figure 2.

Figure 2 – Formulas for Logistic Regression coefficients
Conclusion
Note that Wald represents the Wald2 statistic and that lower and upper represent the 100-α/2 confidence interval of exp(b). Since 1 = exp(0) is not in the confidence interval (.991743, .993871), the Rem coefficient b is significantly different from 0 and should therefore be retained in the model.
% Correct
The % Correct statistic (cell N16 of Figure 1) is another way to gauge the fit of the model to the observed data. The statistic says that 76.8% of the observed cases are predicted accurately by the model. This statistic is calculated as follows:
For any observed values of the independent variables, when the predicted value of p is greater than or equal to .5 (viewed as predicting success) then the % correct is equal to the value of the observed number of successes divided by the total number of observations (for those values of the independent variables). When p < .5 (viewed as predicting failure) then the % correct is equal to the value of the observed number of successes divided by the total number of observations. These values are weighted by the number of observations of that type and then summed to provide the % correct statistic for all the data.
For example, for the case where Rem = 450, p-Pred = .774 (cell J10), which predicts success (i.e. survival). Thus the % Correct for Rem = 450 is 85/108 = 78.7% (cell N10). The weighted sum (cell N16) of all these cells is then calculated by the formula =SUMPRODUCT(N6:N15,H6:H15)/H16.
Finally, note that we can adjust the cutoff for success/failure from .5, as described above, to some other value between 0 and 1.
Examples Workbook
Click here to download the Excel workbook with the examples described on this webpage.
References
Howell, D. C. (2010) Statistical methods for psychology (7th ed.). Wadsworth, Cengage Learning.
https://labs.la.utexas.edu/gilden/files/2016/05/Statistics-Text.pdf
Christensen, R. (2013) Logistic regression: predicting counts.
http://stat.unm.edu/~fletcher/SUPER/chap21.pdf
Wikipedia (2012) Logistic regression
https://en.wikipedia.org/wiki/Logistic_regression
Agresti, A. (2013) Categorical data analysis, 3rd Ed. Wiley.
https://mybiostats.files.wordpress.com/2015/03/3rd-ed-alan_agresti_categorical_data_analysis.pdf
Dear Charles,
Thank you so much for your effort to show how to do significance testing of logistic reg. coeff. in Excel. This has helped me so much!!!
Dear Lena,
Glad I could help.
Charles
Hi!
I would like to thank you for brilliant Idea to show mashine learning concepts in Excel. Math formulas may be difficult for interpretation but Excel formulas are very clear for people with financial background. You are genius!
Thanks, Fedor. You are too kind.
Charles
Greetings,
1. Should the variable r in property 1 be an n, as in the design matrix’s indeces (or vice-versa)?
2. You mention the design matrix being “described in Definition 3 of Least Squares Method for Multiple Regression” but I couldn’t find Definition 3 or any mention of a design matrix on that page. Did I miss it?
Thanks for the great post!
Hello Quinn,
Yes, you are correct on both issues.
1. It should be n.
2. The reference is incorrect.
I have just corrected the webpage. Thank you very much for bringing these errors to my attention.
I appreciate your help in improving the quality of the website.
Charles
Hi Charles, I appreciate the resources of this page but had a question with the logistic regression model I created using your tool. Each time I enter my inputs it appears that my ROC curve is coming out as a 45 degree angle. Additionally, my probability of success rate predictions are very high as well with none below .6. That being said, I have an unbalanced success rate with a ratio of about 4:1. I tried manipulating the classification cutoff but I am unsure of what to make it due to the irregularity of the ROC curve. I was hoping you could provide some insight into these abnormalities.
Pat,
That the ROC is coming out at a 45-degree angle indicates that the model is probably not telling you anything useful for predictions.
If you email me an Excel file with your data and logistic regression results, I will try to give you a more complete answer.
Charles
Hi Charles,
Appreciate the extensive work you’ve carried out to put this all together.
Question – are you able to elaborate on why the distribution of coefficients is considered normal? I ask because significant analysis that follows to determine risk factor appropriateness using p-values necessitates this.
Thanks,
Sukh
Hello –
Love your site. I am new to this, but would like to calculate ORs. What is the best way to do this?
Thanks!
Hello Laurel,
The odds ratio is calculated as described at
https://www.real-statistics.com/logistic-regression/basic-concepts-logistic-regression/
Conceptually, the third formula on the page is appropriate. As far as calculations are concerned, you can use the first formula on this webpage; actually, by taking the exponential (EXP in Excel) of both sides of this equation you get the odds ratio.
Charles
Charles,
Regarding how to calculate the %Correct when the predicted values of p <0.5, it is stated that "When p =0.5? Is the total number of observations the same as the total number of observations for those values for the independent variables or the grand total? Please clarify. In either way, I was not able to reproduce the same number as shown in Figure 1.
-Sun
Hello Sun,
Can you email me the Excel spreadsheet with the results you got for Figure 1? I can then use this to see whether there is an error in Figure 1 or in your spreadsheet.
Charles
Hello Sun,
I am sorry, but I don’t understand your comment.
Are you saying that you are unable to reproduce the same numbers shown in Figure 1 when p = .5?
Charles
Charles,
There is a typo in the statement under Figure 1. Instead of stating “the correlation matrix S”, it should be stated as “the covariance matrix S”.
Thanks,
-Sun
Hi Sun,
Yes, you are correct. Thanks for catching this typo. I have now made the change that you suggested.
Charles
Hi Charles, first of all i want to say thanks to you for your fantastic tool.
I’ve estimated a logistic regression model with one additional independent variable, so i have 3 coeffiecients; 2 + intercept.
The thing is that this model is better than the one with 1 independent variable, in terms of R-square and RMSE, but its coefficients seem to be statistically insignificant since they have p-values that are larger than 0,05. How can i interpret that?
Thanks again, and greetings from Chile.
Hi Mauro and greetings from Italy.
The more independent variables in the model, the higher the R-Square value. This is true whether or not any of the independent variables are significant or not.
Charles
Im trying to do this with just excel, I have managed to create the design results as indicated with “one” column but I can’t get the SE for Coeff B to calculate, when I do SQRT(v7+w8) Instead of DIAG command) I get 0.334 which is the SE of the intercept not the coefficient, what am I doing wrong?
thanks
Hi Chris,
DIAG is an array function and so its output can cover a range with more than one cell.
Since I don’t exactly understand what you did, it is difficult for me to comment further, but it is probably a good sign that you got the se for the intercept. It is likely that you need to use additional formulas to calculate the se of the other coefficients.
Charles
So adding values from V7 and W8 and then SQRT them gave me SE of the intercept
What does the DIAG function actually do with the 2×2 matrix V7-W8 that when you take the SQRT of this array function it gives you the SE of the Coefficient?,
I thought the DIAG function gave you a single column of the diagonal values that are V7 and W8 and ignored the rest of the matrix.
thanks for your help
Hi Chris,
Yes, that is correct. If you place the array formula =DIAG(V7:W8) in Z7:Z8 and press Ctrl-Shft-Enter then cell Z7 will contain the value in V7 and cell Z8 will contain the value in W8. if instead you place the array formula =SQRT(DIAG(V7:W8)) in Z7:Z8 and press Ctrl-Shft-Enter then cell Z7 will contain the square root of the value in V7 and cell Z8 will contain the square root of the value in W8.
Charles
sorry V6 and W7 for above comment my bad
How to calculate Standard errors if we don’t have categories of X but X as a continuous variable
Karan,
The standard errors for a variable X is equal to the standard deviation of X divided by the square root of the number of elements in X.
Charles
If Wald follows Normal Distribution, why cant we use Normal Distribution for Hypothesis Testing?
Dear Karan,
Yes, you can use the z-statistic (and standard normal distribution) instead.
Charles
Dear Charles,
You wrote: “Wald^2 ~ χ2(df) where df = k – k0 and k = the number of parameters (i.e. the number of coefficients) in the model (the full model) and k0 = the number of parameters in a reduced model”
Wald ~ N(0,1) so I would expect Wald^2 ~ χ2(1), since there is only one square of a normal variable.
Shouldn’t DF=1?
Thanks,
O
Dear Oren,
I don’t have a definitive answer for you, but the issue is related to the fact that we are estimating the residual variance from the sample variance. This is why we use a t distribution with a df not necessarily equal to 1 (instead of a normal distribution) to test a regression coefficient in linear regression. See the following webpage for more details: https://stats.stackexchange.com/questions/60074/wald-test-for-logistic-regression
Charles
Thanks Charles 🙂
Yes it is not clear …per the link you mention, it should be Z in logistic regression.
I can see that R (at least the package I tried) is using Z, while SPSS is using Chi-square with df not necessarily equal to 1
from the Link:
“in logistic (and poisson) regression, the variance of the residuals is related to the mean…
E(Y)=np and the variance is Var(Y)=np(1−p) so the variance and the mean are related.
In logistic and poisson regression but not in regression with gaussian errors, we know the expected variance and don’t have to estimate it separately.
…If you perform a logistic regression, the Wald statistics will be the z-value.”
Thanks Oren
Hi Charles,
What would the groups of inputs look like when there are multiple? One variable (rems in your example) makes sense but how does it change if you were to add, say, age to the equation? Would every combination of (rems, age) in the dataset get its own group? What about discrete variables such as if age were measured to the day and no two people had the exact same age?
Dan,
See the following webpage for an example somewhat similar to what you are asking about.
https://real-statistics.com/logistic-regression/comparing-logistic-regression-models/
Logistic regression supports a full range of independent variables of the type described in the multiple linear regression portion of the website.
Charles
Hi Charles,
Thanks so much for you work! It’s very helpful.
I was just wondering about the design function (DESIGN(E6:E15)) for the correlation matrix (which you addressed in a previous comment). I went to https://real-statistics.com/multiple-regression/least-squares-method-multiple-regression/, but was unable to find anything addressing it. The function doesn’t exist in Excel 2013. Is it an Add-In, because I couldn’t find it there either.
Is there a work around?
Thanks!
Emily
Emily,
DESIGN is not a standard Excel function, but it is a function supplied in the Real Statistics addin. If you have installed the Real Statistics addin, you should be able to use the function just like any standard Excel function.
If X is a numeric array, then DESIGN(X) is simply the array X with a column of ones appended to it as the first column.
Charles
Dear Sir,
I am still confused, if I use real statistics, it will instantly found the overall output value. then what if without using real stats but using manual steps. I am confused in finding the standard error. I follow the formula based on real statistics, but can not be used in manual steps. such as DIAG, DESIGN. the word is not found in the excel formula. thank you
Liana,
You are correct. Even the manual approach uses some Real Statistic functions. These function can be replaced by standard Excel formulas. E.g. for the DIAG function see the following webpage:
https://real-statistics.com/matrices-and-iterative-procedures/basic-concepts-of-matrices/
For DESIGN(R1), you can simply use a range with a column of ones appended to the range R1.
Charles
Thanks for finally writing about >Significance Testing of the Regression Coefficients | Real Statistics Using Excel <Loved it! http://leftlanedriver.com/groups/car-games-secrets-revealed/
Hi,
Please, how can we determine the magnitude of variation from Wald test of G*E analysis using Genstat software.
Thank you
Meryem,
Sorry, but I am not familiar with Genstat.
Charles
Hi Charles,
I have use Multinomial Logistic Regression data analysis tool. The exp(b) of coeff int the report is > lower and <upper, but the p-value of coeff is 0.8455, so this coeff retained in the model or not?
Thanks
Anson
If the p-value is .8455, then the coeff is not significantly different from zero.
Charles
Charles,
Thanks for your quick reply.
I have 50 columns of Independent Variables and each column have about 30000 data, only one column for the dependent variables.
So how to calculate each the coeff is significantly different from zero and should therefore be retained in the model?
Anson
Anson,
If p-value < alpha then the coefficient is significantly different from zero. Equivalently, if 1 is not in the confidence interval then the coefficient is significantly different from zero. Charles
Charles,
Thanks for reply.
I have a question for using
MLogitPred(R0, R1, r, iter) function.
I have 20 col x 1001 row raw data with heading. Column A: ref no.
Columns B to E: independent variables
Columns F to T : dependent variables
I have change the value “r” to predict and the result as below:
E2:S2=MLogitPred(A2:D2,ChangeData!$B$2:$T$1001,13), Result=0.04
E2:S2=MLogitPred(A2:D2,ChangeData!$B$2:$T$1001,0), Result=#VALUE
E2:S2=MLogitPred(A2:D2,ChangeData!$B$2:$T$1001,4), Result=#VALUE
So is that mean I use 13 in the r is right?
Anson
Anson,
You saw your data is in raw format, but you also say that columns F to T contain the dependent variables. Both of these can’t be true. If the data is in raw format then there would only be one column for the dependent variables. I will therefor assume that your data is in summary format. Since columns F to T contain the dependent variables and there are 15 columns from F to T, this would mean that your dependent variables are numbered 0, 1, 2, …, 14. Thus r should be 14.
Charles
Dear Sir,technically speaking,does it mean that,the predictors with p>0.05 are useless and we don have something to report,what if in cases when all predictors are insignificant?
Very kindly
Leo,
Assuming that alpha = .05 is the correct significance level, then variables that have p > .05 are not making a significant contribution. But things are never this simple since for example when you have three such variables removing two of them may result in the third being significant.
Charles
Hi,
Thanks for creating this great tool and website.
I ran a logistic regression using the tool on on Mac using the data set as described in the video (https://www.youtube.com/watch?v=EKRjDurXau0) . But I am not getting the p-value table (as can be seen in the screenshot in the webpage above) for all the coefficients to determine the significance of each independent variable. What can be done ?
Shashank,
If you send me an Excel file with your data and results, I will try to figure out what is going on. You can find my email address at Contact Us.
Charles
Hi Charles,
Appreciate the quick response. My problem got solved.
I had large no. of rows so I was not able to locate the table.
thanks
Regards
Shashank
Hi Charles,
I’m still having trouble understanding the meaning of the p value and statistical significance in logistic regression. I want to know how significant are the coefficients. What does it exactly mean that it is statistically significant? From my basic understanding if the p value is below the cutoff point, i.e<0.05 then the variable is statistically significant right? and also, Since there isn't a normal distribution in logistic regression how reliable is the p value?
cheers,
Matt
Matt,
Yes, if the p value is below the cutoff point alpha (e.g. alpha = 0.05) then the variable is statistically significant. This means the (population) coefficient for that variable can be considered to be non-zero (i.e. that variable has a significant impact on the model). Although “there isn’t a normal distribution in logistic regression”, the distribution of the coefficients is normal.
Charles
Hi Charles,
Are you able to elaborate on how the distribution of coefficients is normal or, if assumed, why that assumption can be made?
Thanks,
Sukh
Hi Sukh,
This follows from the assumption that the residuals are normally distributed.
See://www.quora.com/What-is-a-proof-of-the-normality-of-regression-coefficients
https://stats.stackexchange.com/questions/117406/proof-that-the-coefficients-in-an-ols-model-follow-a-t-distribution-with-n-k-d
Charles
Hello
A question about the Wald test. You can determine the Wald test for linear regression? The information I find is used for logistic regression. I want to rule out if I can use it for a linear regression. Gtacias
Is there any particular reason why you want to use the Wald test for linear regression?
Charles
How can i reduce the p value of my intercept coefficient if the p value of all my other variables are satisfactorily low in logistic regtession .
Sankit,
Besides changing your data (e.g. via a transformation), I don’t know how to do this. I also don’t know why you would want to do this.
Charles
Dear Charles,
Alas I am a babe in the logit world and I hope you will be kind enough to point me in the right direction. I have access to a large dataset on student scores that have been previously standardised along the lines of mean 25, s.d. 5. I wish to perform some significance testing between certain groups of students and have struck on the idea that I could/should convert these scores to logit’s using the probability of achieving each ‘raw’ score – essentially treating them as z-scores – and then use these logits in place of the raw standardised scores and conduct z-tests. I am (if it isn’t already painfully obvious) too statistically underskilled to know whether I am committing an egregious blunder with such a plan, but the reference to Wald in your article makes me think that I probably am… Any suggestions on how I might better understand the issue would be very welcome.
Ead,
It is not clear to me what advantage (if any) you get by converting the scores to logit’s. Why can’t you simply use the raw scores?
Charles
Dear Charles
Thank you for your help. I have to run the variables temperature treatments on three groups of 10 plants. i would like to use Anova one-way for variance analysis.
I would like to know if it is the right analysis when i use Anova repeated measures
Sorry, but you need to provide more information before I am able to answer your question.
Charles
Hi Charles,
Fantastic website. Thank you, it’s been very helpful.
I have a binomial logistic regression with 10 independent variables. HL test and R2 indicate the model is a poor fit. I’d like to try to improve the fit by removing variables that have low Wald scores and add in variable interactions. I saw the commentary on creating interactions for multi variable linear regression, but I am not sure if I can copy exactly, or if I need to make further adjustments due to logistic function.
1.) Is there an easy way to add in interactions?
2.) Is there a single best test to use to decide if the model is a good fit? — high AUC, use one of the R2’s, or the HL test?
Thanks again!
Marty
Marty,
1. You can add in interaction of independent variables in exactly the same way as you do for multiple linear regression. I have simply implemented this via x1 * x2, which is easy to do in Excel.
2. There isn’t a simple answer to this question, although I wouldn’t rely too heavily on the HL value. High AUC and R2 are likely to be better indicators.
Charles
Thanks Charles!
One more question, is the de facto R2 “floor” of a binomial logistic regression .50?
If I didn’t use a model and just “guessed”, it seems like I’d have a 50/50 chance of predicting the actual outcome.
Therefore, if my model yields an R2 of .56, does that mean that the model only offers an .06 improvement of what I would have been able to achieve using guesswork alone?
Thanks again,
Marty
Marty,
Your remarks are true for the % Correct statistic, but not for the R2 statistic.
R2 is calculated in a completely different way, and your remarks are not true for R2.
Charles
Hello Charles
Thank you very much for the answer.
I think I can understand a bit better how you did the covariance matrix.
However, all my independent variables are continuous (no repetitions), so that, could be possible to form the groups in function of the probability (as for Hosmer lemeshow statistics)?.
That means to group the cases that are predicted with probability <0.1, <0.2…..<1
Thaks in advance
No problem. Each summary data row will be equivalent to one raw data row. The reported Hosmer Lemeshow value won’t be quite since it is typically based on 10 summarized observations, but that is probably not so important.
Charles
Hello Charles
Could you define what is group i in “property 1”?
I would love to know which parameters did you choose to build the covariance matrix.
In my logistic regression model I only have 2 variables so I will do the covariance matrix by using covar functions.
Thanks
In this context each group consists of any combinations of values of the independent variables. So if you have independent variables Gender and Age and the raw data is
M 30 1
F 31 0
M 30 0
M 32 1
F 32 0
F 31 1
F 30 1
M 32 1
There are 8 sample elements (rows), but some of them can be grouped together, namely the ones where the gender and age are the same. This yields the following summary data (a sort of frequency table). The summary contains 5 groups The 3rd column is a count of all the cases that have a 0 as the dependent variable and the 4th column is a count of all the cases that have a 1 as the dependent variable.
M 30 1 1
F 31 1 1
M 32 0 2
F 32 1 0
F 30 0 1
This is a silly example, but I hope it helps answer your question.
Charles
Dear sir,
I have done logistic regression for 20 independent variables for which all of them are categorical (0 and 1) also 1 binomial response variable. However, the significant test using p-value do not seems right with the variables.
Does using all categorical variable as independent variable effects the result?
Dear Pradash,
The usual logistic regression model doesn’t seem like the correct approach. From what I can tell you need something like a 20-dimension contingency table using log-linear model (see https://real-statistics.com/log-linear-regression/). I am not sure how to handle such a problem. Perhaps someone else can make a suggestion.
Charles
Dear sir,
What is the significance of using value 1 at the 1st column of matrix X?
Ones in the first column of the design matrix X is the way of handling the constant terms.
Charles
If I want to use it for any data. I must put the value 1 is it ?
Yes you need to include the 1’s.
Charles