Basic Concepts
The logit function (see Logistic Regression Basic Concepts) maps a probability, which takes discrete values of 0 or 1, into a continuous value between -∞ and ∞. A function with this property is called a link function. The inverse standard normal distribution function is another link function and is the basis for a regression approach similar to logistic regression, called probit regression.
Let Φ(z) represent the standard normal cumulative distribution function. Then in Excel, Φ(z) = NORM.S.DIST(z, TRUE). The inverse function Φ-1(p) = NORM.S.INV(p) is called the probit function (probit = probability unit) and plays a role similar to the logit function in probit regression. We will also use the notation for the standard normal pdf, φ(z) = NORM.S.DIST(z, FALSE).
The probit regression model takes the form
Φ-1(p) = β0 + β1x1 + β2x2 + … + βkxk + ε
where the residual random variable has a standard normal distribution, i.e. ε ∼ N(0, 1) and p = P(y = 1|X) where X = x1, x2, …, xk. This can also be expressed as Φ-1(p) = Xβ + ε where X = [xj] is a 1 × k+1 row vector of random variables (with x1 = 1) and β = [βi] is a k+1 × 1 column vector of parameters (the regression coefficients).
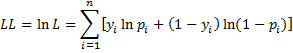
We estimate these population coefficients by coefficients bo, b1, …, bk based on a sample of size n whose ith element is a k+1-tuple of form Xi = xi1, xi2, …, xik. As for logistic regression, we do this by maximizing the log-likelihood statistic
Once again we can use Solver or Newton’s Method to find the coefficients. In the latter case, we use the following properties.
Properties
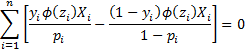
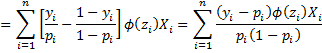
Property 1: The maximum of the log-likelihood statistic occurs when the following k+1 equations hold for j = 0 to k.
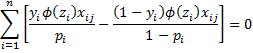
where![]()
and xi0 = 0 and pi = Φ(z) for all i. Note too that these equations can be written in matrix form as
Note too that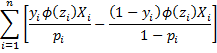
Observation: Thus, to find the values of the coefficients we need to solve the above equations. We can do this iteratively using Newton’s method (see Newton’s Method).
Property 2: Let B = [bi] be the k+1 × 1 column vector of probit regression coefficients, let Y = [yi] be the n × 1 column vector of observed outcomes of the dependent variable, let X = [xij] be the n × k+1 design matrix (as described in Multiple Regression using Matrices). Also, let P = [pi] be the n × 1 column vector of predicted values of success and V = [vij] be the n × n matrix diagonal matrix where
![]()
on the main diagonal and zeros elsewhere. If Bo is an initial guess, and we define the following iteration
![]()
then for sufficiently large m, Bm+1 ≈ Bm, and so Bm is a good approximation for the coefficient vector B.
Property 3: If B = [bi] is an estimate of the regression coefficients and V = [vij] is the n × n matrix diagonal matrix defined as in Property 2 based on the coefficients in B, then the following matrix is a good approximation for the covariance matrix of B
![]()
and so the square root of the elements on the diagonal of this matrix are estimates of the standard errors of the regression coefficients.
See Real Statistics Probit Capabilities for how to perform probit regression in Excel using the Real Statistics Resource Pack based on the above properties.
References
Park, H. M. (2015) Regression models for binary dependent variables using Stata, SAS, R, LIMDEP, and SPSS
https://scholarworks.iu.edu/dspace/handle/2022/19740
Spermann, A. (2009) The Probit model
No longer available online
IT COULD INCLUDE THE BIVARIATE PROBIT MODEL, THE MODEL IS SPECIFIED IN THE GREENE BOOK 8TH EDITION PAGE 807 IMPLEMENTATION IS NOT VERY DIFFICULT
IT WOULD BE A GOOD OPTION TO IMPLEMENT THE AVERAGE MARGINAL EFFECTS, THE ROBUST STANDARD ERRORS IN THE PROGRAM AND OTHER GENERALIZED MODELS SUCH AS THE negative BINOMIAL, WEIBULL and EXPONENTIAL MODEL
for example in poisson:
https://prnt.sc/w8j8xd
https://prnt.sc/w8j9kt
https://prnt.sc/w8j9zf
Antoni,
I don’t understand your comment. Do you have a reference that I can refer to? The attachments that you have provided don’t provide me sufficient information.
Charles
Antoni,
What is the original source of the three images that you referenced?
Charles
I am having a challenge in setting up my data in excel for probit.How do I do it?
Can you please describe the problem that you are having?
Charles
value of slope and resistance ratio?
how can we determine the value of and resistance ratio in probit analysis while using minitab?
Hello Naila,
This website is about statistical analysis in Excel. I don’t use Mintel and so am not able to answer your question.
Charles
Hi Charles
Thanks for the step by step guide on how to use the function.
I was actually looking for a step by step guide on how to use the probit model to forecast recession using variables like yield curve or unemployment ect.
The trouble I’m having is the extent of the data, its not categorical and has a large time series. Then the forecasting part, I’m not exactly sure how i could have a 3,6,12 forecast on what the probability would be. Please could you run me through this step by step so that i have the correct understanding
Regards,
Kevin
Hi Kevin,
Like logistic regression, probit regression requires that the dependent variable takes values that are categorical (0 or 1). FRom what you have said, you don’t have this type of data.
Charles
Hi Charles
I have the outcomes set up as recession (1) and no recession (0) for every point (monthly data) since 1976. The recession (0,1) on the most right column and the each yield curve spread on the left. When using the add-in i select the range, select probit, newton method and choose an output. The results show something a little off. On the classification table, all the predictions have failed at a cut-off of 0.5. The probit regression has a result for each yield spread and my ROC curve is no results.
I don’t know if i am doing something wrong, or if i have to group the data, from the reults i don’t know how to forecast this atleast 12 months forward.
Please can you help, perhaps a quick example. Appreciate your program it is very insightful
Hi Kevin,
If you email me an Excel file with your data and results, I will try to figure what is happening.
Charles
In the diagonal matrix v, is the cumulative distribution function or the density function used?
Antoni,
The density function is used.
Charles
the gradient in the program does not match the theory in the probit model
Antoni,
Are you saying that the formulas written on this webpage (esp. those defining v_ii and B_m+1 just before Property 3) are correct but the coefficients calculated by the program are incorrect?
Charles
PROPERTY 1 DOES NOT MATCH THE RESULTS OF THE PROGRAM
Antoni,
Are you saying that the results for the example at
https://www.real-statistics.com/logistic-regression/probit-regression/real-statistics-probit-capabilities/
don’t match the results obtained via Stata?
Charles
IT WOULD BE A GOOD OPTION TO IMPLEMENT THE AVERAGE MARGINAL EFFECTS, ROBUST STANDARD ERRORS IN THE PROGRAM, AND OTHER GENERALIZED MODELS SUCH AS THE NEGATIVE BINOMIAL, WEIBULL, EXPONENTIAL MODEL
https://prnt.sc/w8il4e
https://prnt.sc/w8im7t
Antoni,
I don’t understand your comment. Do you have a reference that I can refer to? The attachments that you have provided don’t provide me sufficient information.
Charles
GREETINGS I AM FROM PERU, FROM THE CITY OF TRUJILLO, STUDY AT THE NATIONAL UNIVERSITY OF TRUJILLO
IN MULTIVARIATE:
In the Manova model of two factors, the lambda of wilk’s and the value F, the results of the program are wrong, because I check them with the stata and they do not match.
THE THEORY IN REALITY IS CORRECT, EVEN APPLYING ITS THEORY COINCIDES WITH THE STATA BUT THE PROGRAM DOES NOT MATCH THE RESULTS, GREETINGS FROM Trujillo-Peru
Antoni,
Does this mean that the results obtained for the example at
https://www.real-statistics.com/multivariate-statistics/multivariate-analysis-of-variance-manova/two-way-manova-example/
doesn’t agree with those obtained from Stata? If so, what results are obtained from Stata?
Charles
Antoni,
I have now found the error. Thank you once again for your diligence in finding this error. It will be corrected in the next bug-fix version of Real Statistics, which should be available in a couple of days.
I appreciate your help in improving the accuracy of the Real Statistics software and website.
Charles
Antoni,
I have now finally found the error in the probit regression capability. I expect to include the revised version in the next release. This release will also include support for ordinal regression.
Charles
property 1, does not match the results of the program in the probit model, apparently you use the gradient of the logit model so it gives different results
yes, the program results do not match stata
https://prnt.sc/wbu1no
Can you implement nonlinear regression models in the program?
Antoni,
Real Statistics doesn’t provide an all-purpose nonlinear regression analysis tool. Various nonlinear regression models are provided such as the nonlinear exponential regression model, the logistic regression model, etc.
Charles
thanks
I ASKED YOU IF I COULD IMPLEMENT NEW MODELS TO THE PROGRAM LIKE THE NEGATIVE BINOMIAL MODEL OR IMPLEMENT PARTIAL EFFECTS TO THE LOGIT, PROBIT AND POISSON MODELS, ALSO IMPLEMENT THE ROBUST STANDARD ERRORS ANNEX INFORMATION:
http://people.stern.nyu.edu/wgreene/Econometrics/Econometrics-I-20.pdf
Antoni,
I have added your suggestions to my list of future potential enhancements. I hope to get back to econometrics topics shortly.
CHarles
THANK YOU, PLEASE REVIEW THEOREM 1 OF THE PROBIT MODEL, SINCE THE RESULTS OF THE PROGRAM DO NOT MATCH THIS PROPERTY
Antony,
I see that for the example provided on the website the Newton’s method option does not give the correct answer. The Solver approach does seem to work. I have not yet found the error in the code. When I find the problem, I will issue a new release with the correction.
Thank you once again for identifying this error.
Charles
greetings from Trujillo-Peru
If you want to compare results you can do it with the gretl program, since this program also uses robust standard errors in poisson, logit and probit