Scope
On this webpage, we describe some of the worksheet functions that the Real Statistics Resource Pack provides for binary logistic regression. See the following webpages for descriptions of other worksheet functions that support binary logistic regression.
- HOSMER and HLTEST: Hosmer-Lemeshow Test
- LogitCov, LogitConverge, LogitLL, LogitCorrect, LogitROC: Real Statistics Support for Logistic Regression
Also, click here for a complete description of the Logistic and Probit Regression data analysis tool.
Worksheet Functions
Real Statistics Functions: The following are array functions where R1 is an array that contains data in either raw or summary form. Except in the headings, R1 cannot contain any blank or non-numeric entries.
LogitCoeff(R1, lab, raw, head, alpha, iter, guess) – calculates the logistic regression coefficients for data in raw or summary form. Includes the standard errors, Wald statistic, p-value, and 1 – alpha confidence interval. If head = TRUE then R1 contains column headings (default is FALSE). alpha is used to calculate a confidence interval and takes a value between 0 and .5 with a default value of .05.
LogitCoeff2(R1, R2, lab, head alpha, iter, guess) – calculates the logistic regression coefficients as for LogitCoeff. R1 contains the data for the independent variables and R2 contains the data for the dependent variable. If R2 has one column then the data is in raw format, while if R2 has two columns then the data is in summary format. Any row in R1 combined with R2 containing non-numeric data is treated as missing data and is not included in the analysis.
LogitTest(R1, lab, raw, iter, guess) – calculates LL of the full and reduced models, the chi-square statistic, and the p-value for the data in array R1 (without headings).
LogitRSquare(R1, lab, raw, iter, guess) – calculates LL of the full and reduced models for the data in array R1 (without headings) and three versions of R2 (McFadden, Cox and Snell, Nagelkerke) as well as AIC and BIC.
Explanations
Here the arguments lab, raw, alpha, head, iter, and guess are optional.
When lab = TRUE then the output includes row and/or column headings and when lab = FALSE (default) only the data is output.
When raw = TRUE then the data in R1 is in raw form and when raw = FALSE (default) then the data in R1 is in summary form. The parameter iter determines the number of iterations used in the Newton method for calculating the logistic regression coefficients; the default value is 20. guess is an optional column array that specifies the initial coefficient values in the iteration that calculates the regression coefficients. If unspecified, then the coefficients are initialized to zero.
More Worksheet Functions
The Real Statistics Resource Pack also provides the following functions:
LogitPred(R0, R1, raw, iter, guess) – outputs the probability of success for the values of the independent variables contained in each row oR0 based on the logistic regression model calculated from the data in R1 (without headings)
LogitPredC(R0, R2) – outputs the probability of success for the values of the independent variables contained in each row of the range R0 based on the logistic regression coefficients contained in R2 (in the form of a column vector)
LogitSummary(R1, head) – array function which takes the raw data in range R1 and outputs an equivalent array in summary form. If head = TRUE then R1 contains column headings as well as the output.
LogitSelect(R1, s, head) – array function which takes the summary data in range R1 and outputs an array in summary form based on s. If head = TRUE then R1 includes column headings as well as the output. The string s is a comma-delimited list of independent variables in R1 and/or interactions between such variables. E.g. if s = “2,3,2*3” then the data for the independent variables in columns 2 and 3 of R1 plus the interaction between these variables are output.
LogitReduce(R1, s) – array function that takes summary data in range R1 including column headings, and fills the highlighted range with the data in R1 omitting the columns described by the string s, where s is a comma-delimited list of column headings in R1.
LogitCoeffs(R1, iter) – array function which outputs an n+3 × 1 array, where n = # of columns in R1, consisting of the n+1 logit coefficients for R1, an empty cell and the # iterations actually made; iter = maximum # of iterations (default 20).
Observation
LogitCoeffs is a simpler version of the LogitCoeff function with the following added feature. If the algorithm fails before the number of iterations in iter, then the function outputs the values of the coefficients obtained up to that point as well as the # of successful iterations.
LogitSelect and LogitReduce are explained in more detail in Comparing Logistic Regression Models.
Examples
Figure 1 shows the use of some of the Real Statistics worksheet functions described above for Example 1 of Comparing Logistic Regression Models where the model data is in summary form. The output should agree with the output obtained using the Logistic and Probit Regression data analysis tool as shown in Figure 2 of Comparing Logistic Regression Models.
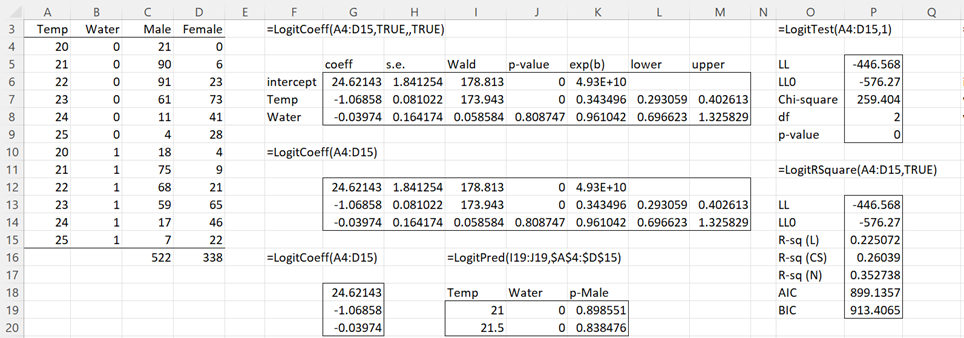
Figure 1 – Use of Logistic Regression functions
Note that the output shown in range G18:G20 and the output shown in range G12:M14 is produced using the same formula, =LogitCoeff(A4:D15). The only difference is the shape of the output range (i.e. the highlighted range).
Predicted Probabilities
To find the predicted probability that a reptile in the study will be Male when the temperature is 21 and there is no water, we use the formula =LogitPred(I19:J19,A4:D15) in cell K19. We see that this probability is 89.9%. If we use absolute addressing for the second argument then we can highlight the range K19:K20 and press Ctrl-D to get the predicted probability when the temperature is 21.5 and there is no water, namely 83.8%.
Note that the predicted value in cell K19 can also be calculated by the formula =LogitPredC(I19:J19,G18:G20).
R-square, AIC, BIC
The LogitRSquare worksheet function produces three versions of the R-square statistic, as described in Comparing Logistic Regression Models. In addition, it outputs the AIC (Akaike’s Information Criterion) and BIC (Bayesian Information Criterion). We have already seen AIC for linear regression (see Significant Testing of Multiple Regression Variables). These statistics are calculated using the following formulas:
AIC = -2LL + 2(k+1) BIC = -2LL + (k+1) ln(n)
where n = the total number of observations. Both of these statistics are used to compare logistic regression models (as described in Comparing Logistic Regression Models) and can be used even when the models are not nested. The lower their value the better the model. Both favor models with fewer parameters (i.e. fewer independent variables), although BIC incurs a larger penalty than AIC for more parameters.
Data in Raw format
We can also use these worksheet functions when the data is in raw format. Referring to Figure 4 and Example 2 of Finding Logistic Regression Coefficients using Newton’s Method we could obtain the results shown in Figure 2.

Figure 2 – Logistic Regression functions with raw input data
Raw data limitation
When working with data in raw format, both the Logistic Regression data analysis tool and the LogitSummary function are limited to 65,500 rows of data. When you have a range with more than 65,500 rows, you need to use the following Real Statistics array function:
LogitMatches(R1, R2) – array function which outputs the total number of successes and failures for each row in R2 based on the raw data in R1.
R1 is an m × n range in logistic regression raw data format without column headings and R2 is a k × n–1 range. The output of the function is a k × 2 range where the first column contains counts of all the matches between R1 and R2 where the last column of R1 contains a 1 (for success) and the second column contains counts of all the matches between R1 and R2 where the last column of R1 contains a 0 (for failure).
Addressing the raw data limitation
We show how to use this function for the raw data in range A3:C52 for Example 2 of Finding Logistic Regression Coefficients using Newton’s Method (the first 15 rows of which are repeated on the left side of Figure 3 below).

Figure 3 – Obtaining a summary using LogitMatches
We first highlight range A3:B52, press Ctrl-C, click on cell E3, and then press Ctrl-V. This makes a copy of the first two columns of the data and places it in range E3:F52. We next select Data > Data Tools|Remove Duplicates. This will remove all the duplicates in the data, leaving the range E3:F9 in Figure 3. Note that this procedure will work even if there are more than 65,500 rows of data even after the duplicates are removed.
Now highlight the range G4:H9 and enter the array formula
=LogitMatches(A4:C52,E4:F9)
After pressing Ctrl-Shift-Enter, the result will be as displayed in Figure 3. It turns out that the output from the LogitMatches function is also limited to 65,500 rows, but you don’t need to handle all the rows at once.
If, for example, the range A3:C200003 holds the original data and the range E3:F100003 holds the data from the first two columns with all duplicates eliminated then you can highlight the range G4:H50003 and enter the array formula
=LogitMatches(A4:C200003,E4:F50003)
Then highlight the range G50004:H100003 and enter the array formula
=LogitMatches(A4:C200003,E50004:F100003)
Even though the original data range contains 200,000 rows and the data range after duplicates are eliminated contains 100,000 rows, by splitting the 100,000 rows in half and using LogitMatches separately on each half we are able to generate the equivalent of the output from the LogitSummary function without violating the 65,500-row limit.
Once you have completed this operation you can use the Logistic Regression data analysis tool, using the summarized output obtained. The Logistic Regression data analysis tool can handle summarized data with more than 65,500 rows.
Examples Workbook
Click here to download the Excel workbook with the examples described on this webpage.
References
Howell, D. C. (2010) Statistical methods for psychology (7th ed.). Wadsworth, Cengage Learning.
https://labs.la.utexas.edu/gilden/files/2016/05/Statistics-Text.pdf
Christensen, R. (2013) Logistic regression: predicting counts.
http://stat.unm.edu/~fletcher/SUPER/chap21.pdf
Wikipedia (2012) Logistic regression
https://en.wikipedia.org/wiki/Logistic_regression
Agresti, A. (2013) Categorical data analysis, 3rd Ed. Wiley.
https://mybiostats.files.wordpress.com/2015/03/3rd-ed-alan_agresti_categorical_data_analysis.pdf
Hi
When I am running logistics regression (logistic as well as Probit), I am not getting values for Covariance Matrix (getting #num), due to that P values are not coming too.
Would appreciate help in resolving this
Hi Singh,
If you email me an Excel file with your data and results, I will try to figure out what is going wrong.
Charles
Hi Charles,
What a fantastic tool you have created! Respect!
Is there dedicated excel function which returns the covariance matrix of B1, B0 coefficients? I get it when I use the add-in GUI, however, a short-cut to this cov matrix would simplify my life 😉
Thank you in advance for your response.
Marcin,
I am not sure what you mean by a “covariance matrix of B1, B0 coefficients”.
If your data in located in range R1 (such as A1:C10), then the covariance matrix for this data can be calculated by the Real Statistics formula =COV(R1). You can use a standard Excel function as described at
https://www.real-statistics.com/multiple-regression/least-squares-method-multiple-regression/
Charles
Charles,
I had in mind the covariance matrix discussed here:
https://www.real-statistics.com/logistic-regression/significance-testing-logistic-regression-coefficients/
the one returned in V6:W7.
is there any way to get it is simpler way ?
Br, M
Marcin,
The array formula in V6:W7 is
=MINVERSE(MMULT(TRANSPOSE(DESIGN(E6:E15)),J6:J15*(1-J6:J15)*H6:H15*DESIGN(E6:E15)))
Here DESIGN(E6:E15) is E6:E15 with a column of ones prior to E6:E15.
There may be a simpler formula, but I haven’t thought of a simpler version.
Charles
Charles,
Thank you for your replay.
Indeed formula for cov matrix works.
However I have encountered other issue.
I’m trying to prepare a “calculator” which can work on various amount of RawData.
I managed to make RawData range dynamicly adjusting to the lenght of input data, by indirect addressing.
The LogitCoeff(RawData;0;1) works very well, and B0 & B1 are calculated correctly regardless amount of raw data I provide.
In order to get the cov matrix I need to prepare summary data, which I do by using your LogitSummary(RawData)…
Unfortunattely, this function doesn’t work on adjusted lenght of RawData range…
I have to erase the array, retype it and spill it again…
Can you think of any solution for this kind of problem?
Thank you in advance
Marcin,
Does this mean that you are using Excel 365? Is the problem that (1) the array overlaps with some other data or (2) LogitSummary can’t be used as a dynamic array (i.e. without clicking Ctrl-Sfht-Enter instead of Enter)?
Charles
“Marcin,
Does this mean that you are using Excel 365? Is the problem that (1) the array overlaps with some other data or (2) LogitSummary can’t be used as a dynamic array (i.e. without clicking Ctrl-Sfht-Enter instead of Enter)?
Charles”
I’m using Excel 2016.
Issue is not a spilling of the results.
I’m trying to create a calculator for non-expierience user.
Idea is that he will paste the RawData in the given columns. Amount of RawData is not always the same (it can be 8 pairs, up to 300 pairs)
Nnce this is done “RawData” range will adjust it’s lenght to cover all input data – this functionality works.
LogitCoef(RawData;0;1) works perfectly, giving B0, B1 immediatelly once RawData gets adjusted…
logitSummary(rawData) doestn’t work on this new adjusted RawData range…
I don’t know why 🙁
Marcin
Marcin,
LogitCoeff works because the size of the output range doesn’t change.
LogitSummary is not so accomodating since the size of the output range might change (depending on the data in the first column of the pairs).
This problem probably doesn’t occur if you are using Excel 365 and set LogitSummary up as a dynamic array function.
Charles
Charles,
Indeed, Office365 is the solution.
Unfortunately not always available.
Can you share how LogitSummary() is written?
…or I’m asking too much 😉 ?
Br, M
Marcin,
I can’t share the code, but the basic idea of the algorithm is as follows:
The algorithm collects all the entries with the same values for the independent variables. The key is to do this in an efficient way.
Charles
Thank you Charles
Hi Charles,
First, thanks for your tool. It must have been a lot of work.
There is an issue you may be able to help me with please. I used the tool to run a Logit regression but the R2 has been very disappointing. Less than 10%. One variable n particular is supposed to explain well the model as it is almost perfectly linear with Y.
Excel gives an R2 of 98% for a linear regression between these two variables while your tool only 60% for the same inputs. I then the log regression is also wrong because of the R2 of a linear regression is close to 1, the full model should be at least a little bit explicative.
Here is the table:
X Y(average of 0/1)
0 0.72
0.05 0.70
0.10 0.63
0.15 0.61
0.20 0.59
0.25 0.56
0.30 0.49
0.35 0.47
0.40 0.48
0.45 0.41
0.50 0.39
Did I miss something?
Thanks again,
Hello,
I don’t understand the problem that you are having since I just ran Real Statistics linear regression data analysis tool on your data and got an R-square value of 98.9% and not 60%.
Charles
Thanks for your reply. Do you think it is because I have office in another language?
I ran the logit on Weko and the results are more aligned with what I was expecting as well
Hard to say. I use Office in Italian without any problems. The usual problem relates to how the data is formatted.
Charles
Thanks again.
That’s why I used a simple reg for testing purposes.
I will investigate it further and let you know.
K
Greetings Charles
I have chosen to move my comments here from the page https://real-statistics.com/logistic-regression/significance-testing-logistic-regression-model/, due to relevance of my inquiry.
I have studied the examples and explanations provided above and calculate all values equally, but disagree your AIC and BIC values in “Figure 1” above, albeit marginally.
From your notes:
AIC = -2LL + 2(k+1), and, BIC = -2LL + (k+1) log(N), where LL = the log likelihood of the full or saturated model, k = the number of independent variables, N = the total number of observations (presumably 860, as per Figure 1 above), and log(N) = the natural logarithm of N (ln(N) in Excel, and log(N) in VBA). Then with five point accuracy, the
AIC = -2 * -446.56787 + 2 * (2 + 1) = 899.13574, and
BIC = -2 * -446.56787 + (2 + 1) * ln(860) = 913.40653.
I may be incorrect, but I suspect that the “1” in the (k+1) term above may have been overlooked.
However, having calculated the AIC for “Figure 1” regardless, this value appears to be exceptionally high for dependent responses which are between and may include 0 and 1, placing a question mark on the use of AIC in this context, as a measure for model cross comparison, especially when model outputs are from a multitude of sources.
Having made this inference, it should be noted that when dependent responses are binary (either 0 or 1), AIC values, MLE’s values, appear comparable.
At this juncture, I must beg forgiveness for my indulgence, but I happened to apply the data set in “Figure 1” above to the glm function in R and Octave and both functions produced an AIC and BIC of 70.32855 and 71.78327 respectively, with the MLE = -32.16428.
I am by no means a scholar, but it would seem, that as the AIC calculation for linear models differs from the glm family, so too do the AIC calculations differ within the binomial models depending on whether response variables are purely binary in nature or a collection of probabilities ranging from 0 to 1.
This is my quandary, and I hoped that as a statistician you might be able to shed some light on the matter.
Many thanks
Anthony
Hi Charles
Further to my enquiry and quandry on the determination of AIC values and MLE’s as detailed above.
I reviewed the source code for R and it is apparent that the AIC values are derived from the binomial distribution of the predicted probabilities, ie and in Excel notation,
MLE = sum(ln(binom.dist(n*y, n, mu, 0))), and the
AIC = -2 * MLE + 2 * (k+ 1),
where y = successes/cases, n = number of cases, and mu = predicted probability (predicted y), and k = number of independent variables.
Thank you again, the problem is resolved.
Regards
Anthony
Hi Charles,
I am having trouble with my logistic regression where all my co-efficients are 0 and hence, all other data columns are #NUM. I have 46 columns of independent variables (multiple categorical columns requiring even more columns of dummy variables), to predict a binary outcome. The same data was utilised with a software and seemed to work fine.
What do you recommend I do to troubleshoot this?
Thanks again for all the advice!
Hi Vighnesh,
How many samples do you have?
Charles
Hi Charles,
My apologies for not expressing myself clearly. I meant comparing two predictions from the same dataset with different parameters. I have the following parameters: Bursary (various amounts), gender, ethnicity (various groupings) & disability (binary).
Thanks,
Simon
Simon,
What hypothesis are you trying to test? That the two predictions are equal?
Charles
Hi Charles,
Many thanks for your reply. The functions you refer to work great and allow me to make predictions without any difficulty. I am still unclear though about determining significance when comparing two predictions?
Thanks,
Simon
Simon,
Please explain why you would have two predictions for the same data. Are you using two different models?
Charles
Hi Charles,
Many thanks for your very helpful pages and functions on this site. I have constructed some logistic regression models (variables: gender, ethnicity, bursary amount) which test the effects of bursary payments on degree performance (binary variable) at a certain university over a number of years. Having got my parameters with their s.errors and intervals, how may I construct confidence intervals for particular predictions from the model please?
Many thanks,
Simon
Simon,
Please look at the following webpage. It explains how to use the LogitPred and LogitPredC functions to make predictions.
https://real-statistics.com/logistic-regression/real-statistics-functions-logistic-regression/
Charles
Hello Charles,
Quick question (I hope.) I have two categorical independent variables – one with 8 levels and one with 2 levels. When I decompose these into dummy variables, I get 8 total (7 from the 8-level variable and 1 from the 2-level variable.) I also want to investigate all 2-way interactions between these variables, so this implies an additional 7 variables: Var1Dummy1#Var2, Var1Dummy2#Var2, … , Var1Dummy7#Var2. So that’s 15 total variables.
I have a full factorial test here, so I have (in summary format) 16 rows of data (8 levels * 2 levels).
This means my (summary format) input for the logistic regression module of your add-in will have 17 rows (16 rows of data + header) and 17 columns (15 variables + success + failure counts).
I am getting an error when running the module: “Input Range must have at least as many data rows as columns”
Is there any way around this, other than arbitrarily removing one of the interaction columns? How can I get all the two-way interactions in my model?
Thanks!
Larry,
This is true of regression models in general. You must have more data if you plan to analyze more variables. I don’t know of any way around this except for adding more data or reducing the number of variables.
Charles
Thanks for your quick reply!
I’m having trouble viewing what I described as 17 variables (although it is in fact 17 data columns). The success/failure columns are really the same variable, but one is the complement of the other. If I summarize them together as a fraction representing the success (so 51 success | 49 failure would become just 0.51 in a single column) would this be workable for logistic regression, in general? It wouldn’t fit within what your module handles as far as I know, but it would satisfy the # of variables <= # of "observations" (data rows, where each row is actually multiple observations summarized into one fractional result.)
I appreciate how you so selflessly share all your hard work and expertise!
Larry,
Changing 51 to .51 is not acceptable since the value needs to be a non-negative integer. But also don’t understand how this would solve the problem you are having.
Charles
Hey Charles, first of all, thank you very much for the add-on, it’s certainly the best I have encountered and I will not hesitate to share it with my fellow colleagues.
Yet I am facing a challenge, namely, when I display my logistic regression’s output, the “coeff” array contains ” #VALUE! ” which leads to all the other cells that refer back to this array to display the same error. I have tried experimenting a bit with the =Logitcoeff function that seems to cause the problems but I haven’t found an explanation yet…
PS : I’m running excel 2016 on MacBook.
What possible mistake am I doing?
Thanks in advance.
Adonis,
The usual problem is that the logistic regression model doesn’t converge to a solution. You can check this by running the Solver as well as Newton’s Method version of the data analysis tool.
There is no clear cut reason why the model fails.
If you send me an Excel file with your data and analysis I will check to see whether this is the problem that you are having.
Charles
Thanks a lot Charles I’ll forward you the excel file!
NB: my data set consists of 9 independent variables and 15000 rows.
I tried to use LogitSelect with the argument s=”2″. This failed. LogitSelect only works for me if I select I include any number of columns from the left side, e.g., s=”1″ works, s=”1,2″ works, s=”1,2,3″ works, but s=”1,3″ does not work. Am I doing something wrong?
Cristtian,
If you send me an Excel file with your data and output I will try to figure out what went wrong.
You can find my email address at Contact Us.
Charles
Hello Charles, can’t thank you enough for everything on this website 🙂
My data does not converge it appears that i have the “perfect separation” problem, any idea on how can i apply the “Firth Bias-reduced” logistic regression on excel ? I installed your mac addin already (its a small sample 30 rows)
Mohamed,
The following is a link to the paper by Firth on this topic.
stat.duke.edu/~scs/Courses/Stat376/Papers/GibbsFieldEst/BiasReductionMLE.pdf
I would imagine that it is not a trivial problem to implement the approach described in the paper.
Charles
Thanks Charles, will check and let you know
Hi Charles,
Is there a limit to the number of columns that the logitmatches function can handle? I have around 409 rows but 16 different columns for the independent variables. I tried using the logitmatches function but got an error of #VALUE!. I tried splitting up the data to have less rows as you mentioned but it still didn’t work.
Could you help me out with this?
Thanks,
Matt
Matt,
409 rows and 16 columns is not very high and so you don’t even need to use the logitmatches function.
If you send me an Excel file with your data and results, I will try to figure out what is going on.
You can find my email address at Contact Us.
Charles
Thanks for a very useful set of functions and tools.
Given an expected probability it is possible to calculate an “x” value from the output of the logistic tool as on the logit 3 example worksheet in the Examples workbook part 2. How can one calculate the confidence interval round that “x” value?
Since x is the independent variable, I don’t know what you mean by a confidence interval for the x values.
Charles
Thanks for your very rapid reply!
If a probability is required (say 95%) one can calculate the x value that would give that probability from the formulae at the left of the logit 3 example sheet by using Solver to set p to the required value by adjusting the x value. It is the confidence interval of that x that I hope to be able to calculate. “What x value (irradiation say) can I accept to expect a survival proportion of 95% and with that x value what is the confidence interval of the survival?”
Julian,
This is an interesting question. First we need to define what such a confidence interval would be.
Let me discuss a similar problem by referring to Example 1 of Confidence and Prediction Interval for Linear Regression (see Figure 2). The predicted value of x = 20 is y = 73.16 with a prediction interval of (55.36, 90.95). So if I ask for the prediction interval of x when y = 73.16, I need to figure out what this means. One approach is to find the x values that correspond the y values 55.36 and 90.95. This would result in a “prediction interval” of (-8.3, 48.3) for x = 20. I calculated these values by trial and error, using the formula =RegPred(P4,A4:A18,B4:B18,TRUE) where P4 contains the trial value of x and looking for outputs of 55.36 and 90.95.
If this approach makes sense, a similar thing can be done for logistic regression.
Charles
Hi Charles,
First off, congratulations for this website, it s explicative and very helpful.
I just have a problem which I think it s easy to solve, but bc of time constraints I need to cut it short and ask you for your help.
I have 16 patients total, 5 with disease and 11 w/o disease. In each of these patients we measured a variable in different location (n=14). I wanted to know if with these premises , I can find a cut-off value which can discriminate disease/no disease. FYI I used Levene(equal variances) and Kruskall Wallis (small sample) and found out that the variable (mean value) is higher in disease and the difference is stat significative (p<.05). I was thinking about binomial logistic regression? (X=disease/no disease and Y mean variable value per patient?) I am a bit confused. Thank you so much, I hope I was clear.
Francesco,
I don’t completely understand the scenario, but based on my understanding of the situation binary logistic regression could be the correct way to go.
Charles
Hi Charles,
I want to predict the probability of a Default given the credit card balance. My raw data consists of 400 records where the credit card balances range distinctly from $0 to $2000. Another column is binary indicating the Default.
I am having some problems with the LogitSummary function. I have also used Binary Logistic Regression (from Ctrl-m). The output is the same, almost 400 records.
It seems to me that the credit card balance data should be binned into ranges of some width of say $100. Excel’s Frequency function could provide the start of it. Knowing the number of accounts for any range and the number of defaults within any range should produce the observed probability for any range as well.
Unlike linear regression where raw data works just fine, in the case of logistic regression a lot of work on the raw data seems to be necessary to produce a required vector of observed probabilities.
It could be interesting to try both approaches: one using the raw data and the other using ranges of data and see which model best fits the data.
Charles
Using raw data makes no sense because the observed probabilities are either 0% or 100%, either a default or no default.
My goal is to recommend credit card limits. Looking at my data I can see that defaults are much more frequent with higher balances. I can also see that defaults are much more frequent if the card holder is young, a student, unemployed, or has a low income.
For example, what credit limit should I recommend for a 20 year old student with a low income so that the probability of a default stays below 5%?
I am hoping to solve this problem using logistic regression. I am surfing the web for literature to help me. Would you know where I should look?
Charles,
Thank you so much for all the information and resources on this site. As amazing as it is I am still in need of some help. I have a logistic model that works well, but the next step is have the model run in the background and map it against real data to confirm the continued accuracy. Sample is very dynamic so it must be updated regularly changing the sample portions and coefficients. Do you have a recommendation/function that calculate p-score and immediately add the new data to the sample while bumping off the oldest observation? Example, calculate p-score with individual observation, p-score=.85 threshold is .5 observation receives a 1. Observation data added to sample, and oldest recoded prediction of 1 is removed. Any help would be greatly appreciated.
Matthew,
You can use the Logistic Regression functions instead of the data analysis tool, but you probably need to write a program to automate the process. The good news is that you can call any of the Real Statistics functions from within a VBA program. See the following webpage for details:
Calling Real Statistics Functions from VBA
Charles
Thank you Charles.
Do you by chance have a write up for the logic that the data analysis tool utilizes?
Hi Charles,
I have two questions.
1. Where can we get the “likelihood ratio” from the Logistic Regression Excel output as in the above figures?
2. Which R-square [R-Sq (L); R-Sq (CS); R-Sq (N) ] represents the “goodness of fit” for the model?
Thank you in advance for your response.
1. The LL value can be obtained from the LogitTest or LogitRSquare functions as shown in Figure 1.
2. They all represent a sort of goodness of fit value, but the situation is not as clear as for linear regression.
Charles
Thank you so much for your response!
One thing for sure, your website is one of my favorites now. Keep up sharing 🙂
Whenever I am trying to do logistic regression, its showing “compile error hidden message”. What possible mistake am I doing?
To try to answer your question, please answer the following questions:
1. When do you see this message: (a) when you press Ctrl-m (or select Real Statistics from the Add-ins ribbon), (b) when you choose Regression or Logistic Regression from the initial dialog box or (c) when you press OK on the Logistic Regression dialog box?
2. What version of the operating system are you using (Windows XP, Vista, 7, 8, 8.1, Mac OS)? What version of Excel are you using?
3. What value do you get when you enter the formula =VER() in any cell in a spreadsheet?
4. Are you able to use some other Real Statistics data analysis tools without getting a similar message?
Charles
Hi,
Is it at all possible to call a full logistic regression Direct from Vba?
Only item that may differ between iterations will be the input range.
Thanks in advance
Hi Martin,
You can use any of the Real Statistics functions from VBA as described on Calling Real Statistics Functions in VBA.
Charles
Hi Charles,
I tried to use the LogitMatches and I followed all the steps stated in this page for this function but the the result was displayed as #NAME?
for all summery cells ?
Please reply to me ASAP 🙁
Many Thanks,
Shosho,
This is surprising. The LogitMatches function was introduced in Release 2.13 in May 2014; so as long as you are using this release or a later one, you should at least have access to the function. What do you see when you enter =VER() in any cell?
Charles