Objective
We now show how to find the coefficients for the logistic regression model using Excel’s Solver capability (see also Goal Seeking and Solver). We start with Example 1 from Basic Concepts of Logistic Regression.
Example
Example 1 (Example 1 from Basic Concepts of Logistic Regression continued): From Definition 1 of Basic Concepts of Logistic Regression, the predicted values pi for the probability of survival for each interval i is given by the following formula where xi represents the number of rems for interval i.
![]()
The log-likelihood statistic as defined in Definition 5 of Basic Concepts of Logistic Regression is given by

where yi is the observed value for survival in the ith interval (i.e. yi = the fraction of subjects in the ith interval that survived). Since we are aggregating the sample elements into intervals, we use the modified version of the formula, namely

where yi is the observed value of survival in the ith of r intervals and
 Initializing Solver
We capture this information in the worksheet in Figure 1 (based on the data in Figure 2 of Basic Concepts of Logistic Regression).

Figure 1 – LL based on an initial guess of coefficients
Column I contains the rem values for each interval (copy of columns A and E). Column J contains the observed probability of survival for each interval (copy of column F). Also, column K contains the values of each pi. E.g. cell K4 contains the formula =1/(1+EXP(-O5–O6*I4)) and initially has a value of 0.5 based on the initial guess of the coefficients a and b given in cells O5 and O6 (which we arbitrarily set to zero). Cell L14 contains the value of LL using the formula =SUM(L4:L13); where L4 contains the formula =(B4+C4)*(J4*LN(K4)+(1-J4)*LN(1-K4)), and similarly for the other cells in column L.
Fill in Solver dialog box
We now use Excel’s Solver tool by selecting Data > Analysis|Solver and filling in the dialog box that appears as described in Figure 2 (see Goal Seeking and Solver for more details).

Figure 2 – Excel Solver dialog box
Our objective is to maximize the value of LL (in cell L14) by changing the coefficients (in cells O5 and O6). It is important, however, to make sure that the Make Unconstrained Variables Non-Negative checkbox is not checked. When we click on the Solve button we get a message that Solver has successfully found a solution, i.e. it has found values for a and b which maximize LL.
Output from Solver
We elect to keep the solution found and Solver automatically updates the worksheet from Figure 1 based on the values it found for a and b. The resulting worksheet is shown in Figure 3.

Figure 3 – Revised version of Figure 1 based on Solver’s solution
We see that a = 4.476711 and b = -0.00721. Thus the logistics regression model is given by the formula
![]()
For example, the predicted probability of survival when exposed to 380 rems of radiation is given by
![]()
Note that
![]()
Thus, the odds that a person exposed to 180 rems survives is 15.5% greater than a person exposed to 200 rems.
Data Analysis Tool
Real Statistics Data Analysis Tool: The Real Statistics Resource Pack provides the Logistic and Probit Regression data analysis tool. This tool takes as input a range that lists the sample data followed by the number of occurrences of success and failure. For Example 1 this is the data in range A3:C13 of Figure 1. For this example, there is only one independent variable (number of rems). If additional independent variables are used then the input will contain additional columns, one for each independent variable.
We now show how to use this tool to create a spreadsheet similar to the one in Figure 3. First, press Ctrl-m to bring up the menu of Real Statistics data analysis tools. Next, choose the Binary Logistic and Probit Regression option from the Reg tab, and press the OK button. (The sequence of steps is slightly different if using the original user interface). This brings up the dialog box shown in Figure 4.
Figure 4 – Dialog Box for Logistic Regression data analysis tool
Now select A3:C13 as the Input Range (see Figure 5). Since this data is in summary form with column headings, select the Summary data option for the Input Format and check Column headings included with data.
Next, select the Solver as the Analysis Type and keep the default Alpha and Classification Cutoff values of .05 and .5 respectively. Since we have selected the Solver option, we also need to select the Show item by item details in output option.
Observations
This tool takes as input a range that lists the sample data followed by the number of occurrences of success and failure (this is considered to be the summary form). E.g. for Example 1 this is the data in range A3:C13 of Figure 1 (repeated in Figure 5 in the same cells). For this problem, there was only one independent variable (number of rems). If additional independent variables are used then the input will contain additional columns, one for each independent variable.
Output from data analysis tool
Finally, press the OK button to obtain the output displayed in Figure 5.
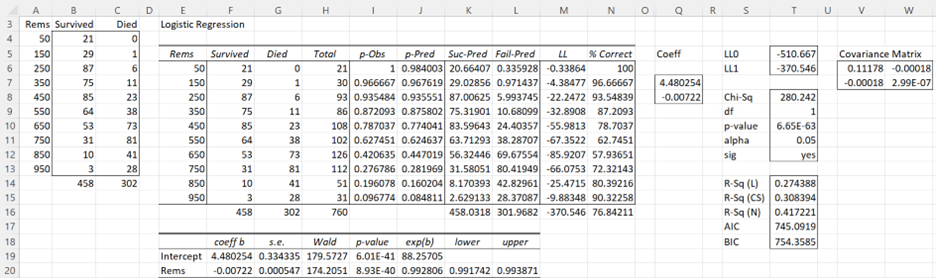
Figure 5 – Output from Logistic Regression tool
Note that the regression coefficients in Q7:Q8 are the same as those we obtained previously in Figure 3. The output from the Logistic Regression data analysis tool also contains many fields which will be explained elsewhere.
Note that the data analysis tool initially sets the coefficients (range Q7:Q8) to zero and so LL (cell M16) is calculated to be -526.792 (exactly as in Figure 1). As described in Figure 2, the data analysis tool then uses Solver to find the logistic regression coefficients shown in Figure 5 (and calculates other interesting values as well).
Examples Workbook
Click here to download the Excel workbook with the examples described on this webpage.
References
Howell, D. C. (2010) Statistical methods for psychology (7th ed.). Wadsworth, Cengage Learning.
https://labs.la.utexas.edu/gilden/files/2016/05/Statistics-Text.pdf
Christensen, R. (2013) Logistic regression: predicting counts.
http://stat.unm.edu/~fletcher/SUPER/chap21.pdf
Wikipedia (2012) Logistic regression
https://en.wikipedia.org/wiki/Logistic_regression
Agresti, A. (2013) Categorical data analysis, 3rd Ed. Wiley.
https://mybiostats.files.wordpress.com/2015/03/3rd-ed-alan_agresti_categorical_data_analysis.pdf
Hi, Charles. Can you explain or give link where to find an information how to maximize values of LL without using solver. I mostly use apple devices (iphone) for my statistical and scientific work and I don’t have and an access to excel and it instruments, most functions I replaced by standard mathematical instruments, but maximizing procedure I can’t understand. Please help me.
See https://real-statistics.com/logistic-regression/finding-logistic-regression-coefficients-using-newtons-method/
Charles
Thanks a lot. I’ll study this block and recommended book.
Charles,
Regarding the Real Stat Data Analysis Tool for the logistic regression, the analysis option screen presented in Figure 4 does not match with the option in the actual software. Under the “Reg”, there is a mulinomial logistic regression. Within this analysis, the analysis dialogue box does not contain the analysis types of Newton’s or Solver option at all.
The version I have the most current one (v6.8). Would you please check whether I am looking at the correct analysis option available in the software.
Thanks,
-Sun
Hi Sun,
This data analysis tool now handles both logistic regression and probit regression. I have just updated the webpage to display the revised dialog box. It still contains an option for Solver vs Newton’s method.
Thanks for bringing this issue to my attention.
Charles
Dear Charles,
In this example the odds ratio can be calculated. How do we do it when the dependent variable is 0 or 1 like
Y X1 X2
1 2.1 3
0 1.9 3.2
0 2.3 3.5
………
In other words what is the dependent variable with the above data?
Thank you.
Hello,
The odds ratio for logistic regression is defined at
https://real-statistics.com/logistic-regression/basic-concepts-logistic-regression/
Charles
Dear Charles,
Many thanks for this wonderful step-by-step handholding tutorial! It is helping me to better understand the fundamentals and learn how to do the regression.
I have a question about logistic growth. Suppose I know the housing area per capita in a country (m2 per person) follows a S-curve logistic growth, as a function of time. And the data I have is something like below:
X (Year): 2000, 2001, 2002, 2003, 2004, 2005, … 2017
Y (m2/person): 11, 12, 12, 13, 15, 16, … 21
And I also know that the growth will ultimately approach its maximum level, e.g. 100 m2/person by 2050.
If I want to model this growth via logistic regression, I guess I have to firstly convert the Y values to proportions (p) by dividing each year’s value by the maximum level. This gives me:
Converted Y (proportions, p): 0.11, 0.12, 0.12, 0.13, 0.15, …0.21
Then I use Converted Y (p) = 1 / 1 + exp (-a-bx_i) to do the regression, just as what you taught us above. And, in my case, the n is just 18 (from 2000 to 2017), and there is no need to have (B4+C4) in the formula in column L. Correct?
Is this the correct approach? Please enlighten me. Many thanks.
Wayne,
Glad to see that my step-by-step explanation was helpful.
Which figure are you referring to when you speak about column L? If I understand what you are suggesting correctly, it sounds like you are using linear regression after making a logit transformation where the y values are not zero or one.
Charles
Dear Charles,
Thanks for your reply. Column L is the column for log-likelihood in Figure 1 above.
I am not sure if I explained my case clearly enough. What I have is NOT data for “typical” logistic regression such as Survived vs Died, Win vs Lose, Choose vs Not Choose, etc. Rather, what I have is a time series data, something like housing area per person (m2 per person). Assuming the future trend of housing area per person will follow a logistic growth and the maximum possible level is a pre-defined number, say 50 m2/person in a future year.
So, to be able to define the logistic regression coefficients, I have to firstly transform the housing area per person to be a “proportion”, i.e. housing area per person divided by the maximum possible level. After this, the y values are within the range of 0 and 1. Then I use the approach that you taught in your example.
Please could you let me know if I am doing this correctly? Thank you so much.
Wayne
I used Solver to minimize the sum of Ni*[Pi-Yi]^2.. much like the least square error method that we used in linear regression. I get very, very similar results to the LL maximization, but not exactly the same.
Guessing that LL method is technically superior? I find the least method easier to grasp. If we look at weighted RSQ between Pi and Yi (weighted by Ni), least square minimization shows slightly better.
BTW – thank you Charles for some of best explanations and examples that even I can understand. Glad I found this site.
Guru,
Thanks for using the website. I try to provide easy-to-understand, but not dumbed-down explanations. Glad that you are getting value from the website.
Charles
Hello,
I’m using Real-Statistics and it looks fantastic!
Unfortunately I have a problem with using Real-Statistics in order to estimate the Probability of Default of 20 companies.
I used the Altman Z-Score factors working capital/total assets, retained earnings / total assets, earnings before interest and taxes / total assets, market value of equity / book value of total liabilities and sales / total assets. When I use Real-Statistics for it I seclect binary logistic regression, raw data and for the range I select the 5 columns containing these factors and one column with the default variable (1=default, 0=no default).
Real-Statistics seems to predict always 1 or a number almost 0 like 8.24413E-13
or something for p-pred.
What am I doing wrong? I know for Real-Statistics 1 is success and for me it is default, but that should not be a problem, since I can look at the complementary probability…
Maybe someone can help me.
Greets
Peter Trapp
Peter,
If you send me an Excel file with your data and analysis, I will try to figure out what is going on.
Charles
Charles,
thanks for the reply. I think I need more data.
At the beginning, I only had the data of these 20 companies for one year. Now I collected them for 6 years, but still the weights are estimated in a way, that p-pred is always 0 or 1. I think, that I need more data in order to have some fluctuation…
Is there a rule of thumb, how many values I need?
Here, I have uploaded the EXCEL file:
https://uploadfiles.io/1f9dz
Thank you for your help Charles!
Peter Trapp
Dear Charles,
I am in a serious trouble of finding the values of the covariance matrix of values
0.111768 -0.00018
-0.00018 2.99E-07 As shown in figure 6. Please show me the hand calculation.
Thanks,
Sisay,
See Property 1 on the following webpage:
https://real-statistics.com/logistic-regression/significance-testing-logistic-regression-coefficients/
Charles
Dear Charles,
thank you so much for this wonderful tool.
A little question: is there a way to put constraints on coefficients in Binary Logistic Regression? We need all the coefficients be non-positive, and we used a “Subject to the Constraints” feature in Excel Solver. Is there a same feature in Real Statistics Data Analysis Tool?
Nadja,
The only approach I can think of is to use Solver as you have done.
Charles
Hi Charles,
I just downloaded real stats and placed it into excel. In the past, I have used solver to determine power ratings for NFL teams with the purpose of determining a true point spread and total for betting on sports. However, solver uses linear regression and while it does a good job, I believe that a logistic regression markov chain may be a more dynamic option. I know that major sports betting syndicates use logistic regression for these purposes but of course they will not reveal how they do it. What I want to accomplish is get close to that. Can this be done in excel with the real stats package? I have years of data and statistics and what I want to accomplish is to power rate these NFL teams, determine each teams home field advantage, and ultimately forecast a final score. Also, you must realize, I am not one of these MIT statisticians. I never went to school for statistics. But I do know sports statistics and how they are valued when it comes to betting on sports. How would I go about determining the above in excel using the realstats package. If you could help me I would be forever grateful. If this is a major project, I understand your time is valuable. Just need to be pointed in the right direction.
Bob,
I have not tried to implement this sort of approach myself using logistic regression, but it is pretty easy to use the Real Statistics Logistic Regression data analysis tool, and so I suggest that you start by just playing around with it to see how it works. I am available to answer questions.
Charles
Thank you very much for your statistical tools and providing helpful hands-on examples. You are in a league of your own. Combining complex statistical knowledge with the creation of simple to use tools is no small feat!
I am working on a problem for which I would require your guidance. I am trying to determine how performance rating is linked to gender and position level in our organization. I am assuming that I working with an ordinal model since the ratings range from 1 (did not meet, i.e., bad performance) to 5 (surpassed, i.e., excellent performance). Gender is male=0, female=1 and, level is 0 to 4. What regression approach should I use, binary or multinomial? The data looks like this:
Gender Level 1 2 3 4 5 Total
00 16 167 790 377 78 1,428
0 1 5 69 366 220 61 721
0 2 0 19 225 186 78 508
0 3 0 3 57 47 24 131
0 4 0 0 13 21 19 53
1 0 3 109 762 364 84 1,322
1 1 2 39 273 195 58 567
1 2 1 17 155 143 67 383
1 3 0 2 39 28 20 89
1 4 0 0 10 10 8 28
Marc,
If the dependent variable takes only two values (e.g. Male or Female), then use binary logistic regression. If the dependent variable takes a small number of values more than two (e.g. North America, Europe, Asia), then use multinomial logistic regression.
Charles
Hi Charles,
Is there a place where all the information that is given in the output shown in Figure 6 is explained?
Thanks,
Ryan
Ryan,
The explanation is spread over various webpages. These webpages are listed at
Logistic Regression
Charles
Hello,
I apologize, as this has probably already been asked, but do you know of the way to solve for a and b by hand, rather than in a statistics software? Or could you possibly direct me to a place which shows it? I’ve tried looking, but it just seems as if every site either relies on Stata, R, or Excel to find a and b rather than calculating them out.
Best Regards
Lauren,
The following two webpages explain how to find the coefficients manually, but it is not easy to do the calculations by hand.
Logistic Regression using Newton’s Method
Logistic Regression using Newton’s Method detailed
Charles
Hi, Charles!
First off, I would like to thank you for this insightful discussion that you gave. It helped me a lot! I would just like to ask though, what if I would like to determine the coefficients for a logistic regression model that I’m working on. I have several independent variables, would it be advisable that I determine their coefficients individually or is there another method which I could use to determine them simultaneously?
Your reply will be very much appreciated! Thanks in advance!
Hi TJ,
It is best to determine the coefficients all together, as described in Example 2 or 3 of the following webpage
Finding logistic regression coefficients using Newton’s method
Charles
Dear Charles
I am glad to find this site about logistic regression, I have a data dependent variable is binary(1,0), and 28 independent variables are both metric and non metric variable, once I run the logistic regression in Excel and SPSS, most of the coefficients getting negative and zero. is this affect show on prediction?, how do i resolve this issue? also give hint of method to significance test for logistic regression.
Thanks
Satish
Dear Satish,
Without seeing your data I have no way of commenting about why the coefficients are negative or zero. Also, please note that there is nothing wrong with negative coefficients, and so there may be nothing to resolve.
Regarding your second request, please see the following webpage:
Testing the Fit of a Logistic Regression Model
Charles
Hi Dr Charles,
I’m wondering if you can help – do I always need to zero out the coefficients I’m trying to solve for before hitting the solve button? I’m normalizing energy consumption using the logit-3, logit-4 or gompertz models, and when I zero out the coefficients before solving I get one answer, but if I leave in the coefficients that were the results from last years model and then hit solve, the answer differs…
Any comments or advice would be more than welcomed!
Sorry Lee, but you haven’t given me enough information to enable me to comment.
Charles
Hi Charles, this provides a great introduction, thanks for putting in the time to elaborate, and from all the comments your blog is off assistance to many readers. I have a questions when we introduce a secondary variable, lets say age in your example. I have done so by creating a secondary table of categorical values, and followed the same method. I have created ‘a’, ‘b’, and ‘c’ and set them to zero. So now I have two tables similiar to Fig 1 (ie. all pi values are 0.5 – because a=b=c=0 currently)
Now for pi_table1 i use the following equation 1/(1+exp(-a-b*t1x)
For pi_table2 i use the following equation 1/(1+exp(-a-c*t2x)
When I go to the solver, and tell it I want to maximise the two LL values, by changing ‘a’, ‘b’ and ‘c’, i get an error that says “Objective Cell must be an objective cell on the datasheet”.
in my “Set Objective” box I have LL_table1 cell ; LL_table2 cell
I have put in a formula to solve pi in the
Sorry Luke, but I don’t completely follow what you are trying to do. Also you comment is incomplete and ends with “I have put in a formula to solve pi in the”. It seems like you are trying to maximize two cells at once. Solver doesn’t do this, although you can probably come up with a way to combine the maximization of two values into one.
Charles
Dear Dr. Charles,
I have been trying out your Logistic Regression tool using the data set below. This data set is part of the famous Fisher data set for irises. The binary outcome is called Type and appears in the last column. The first four columns are iris properties.
I decided to use the Logistic Regression tool with just one independent variable at a time. For SL and Type, the output coefficients are fine. Same is the case for SW and Type. However, if I try PL and Type or PW and Type, the program complains #VALUE is all the cells including p-Pred. My suspicion is that as the computer searches the parameter space to determine coefficients, the logit sometimes get large, and Excel does not know how to handle numbers beyond approx. exp(710). Please let me know what to do. Thanks.
PW PL SW SL Type
2 14 33 50 0
2 10 36 46 0
2 16 31 48 0
1 14 36 49 0
2 13 32 44 0
2 16 38 51 0
2 16 30 50 0
4 19 38 51 0
2 14 30 49 0
2 14 36 50 0
4 15 34 54 0
2 14 42 55 0
2 14 29 44 0
1 14 30 48 0
3 17 38 57 0
4 15 37 51 0
2 13 35 55 0
2 13 30 44 0
2 16 32 47 0
2 12 32 50 0
1 11 30 43 0
2 14 35 51 0
4 16 34 50 0
1 15 41 52 0
2 15 31 49 0
4 17 39 54 0
2 13 32 47 0
2 15 34 51 0
1 15 31 49 0
2 15 37 54 0
4 13 39 54 0
3 13 23 45 0
3 15 38 51 0
2 15 35 52 0
3 14 34 46 0
5 17 33 51 0
2 14 34 52 0
6 16 35 50 0
3 14 30 48 0
2 19 34 48 0
2 12 40 58 0
2 14 32 46 0
4 15 44 57 0
2 15 34 52 0
2 15 31 46 0
3 13 35 50 0
3 14 35 51 0
2 16 34 48 0
2 17 34 54 0
2 15 37 53 0
24 56 31 67 1
23 51 31 69 1
20 52 30 65 1
19 51 27 58 1
17 45 25 49 1
19 50 25 63 1
18 49 27 63 1
21 56 28 64 1
19 51 27 58 1
18 55 31 64 1
15 50 22 60 1
23 57 32 69 1
20 49 28 56 1
18 58 25 67 1
21 54 31 69 1
25 61 36 72 1
21 55 30 68 1
22 56 28 64 1
15 51 28 63 1
23 59 32 68 1
23 54 34 62 1
25 57 33 67 1
18 51 30 59 1
23 53 32 64 1
21 57 33 67 1
18 60 32 72 1
18 49 30 61 1
23 61 30 77 1
18 48 30 60 1
20 51 32 65 1
25 60 33 63 1
18 55 30 65 1
22 67 38 77 1
21 66 30 76 1
13 52 30 67 1
20 64 38 79 1
20 67 28 77 1
14 56 26 61 1
18 48 28 62 1
24 56 34 63 1
16 58 30 72 1
21 59 30 71 1
18 56 29 63 1
23 69 26 77 1
19 61 28 74 1
18 63 29 73 1
22 58 30 65 1
19 53 27 64 1
20 50 25 57 1
24 51 28 58 1
Uday,
The problem seems to be different. For the case of PW and Type, if PW is <= 6 then the outcome is always a failure, while if PW >= 13 then outcome is always a success. There is no data where PW is between 6 and 13. This trivial situation prevents the model from converging to a solution. In any case, the correct model is not given by a logistic regression model, but by the rule success is equivalent to PW >= 13, failure to PW <= 6 and undetermined for values in between. The situation is similar for PL and Type. One question I have for you, is why aren't you using all the variables instead of just one? Charles
Thanks for your prompt response. Just like you suggest, I had started by using all the four variables at one time, and received all the #VALUE! responses. In order to identify why, I gradually reduced the number of independent variables. Just like you, I found that PW and PL are step functions, and that this is the source of why the Logistic Regression tool (as it currently stands) is not able to find a solution.
From a deeper viewpoint, a step function is the limiting case of the logistic s-curve, so I looked into why Excel cannot get a solution. I think the problem is that the logit sometimes get large, and Excel does not know how to handle numbers beyond approx. exp(710). So when calculating the probability, 1/(EXP(-Logit)+1, I was thinking that an IF statement like =IF(E2>-700, 1/(EXP(-Logit)+1),1) may work.
In any case, it would be nice to have a tool which works for data which happen to be step functions.
Uday,
Have you tried making the change on one of the spreadsheets? Does it solve the problem? If so, I will make the change you suggest.
Charles
Dear Charles,
I am sorry I did not get back to you sooner – got sidetracked into other problems! In any case, I did make the change referred to above and tested it. It vastly improves the usage of the logistical regression tool, in particular for data which may happen to be close to step functions. In order to keep the Logit value from becoming too large or too small (both of which are problems for Excel) in the Solver process, a well-chosen IF statement works really well. Suppose we want to keep Logit in the range -30 to 30. Then, basically where you have the statement =1/(EXP(-Logit)+1) for computing the output on the spreadsheet, I changed it to =IF(Logit>30, EXP(-30), IF(Logit>-30,1/(EXP(-Logit)+1),1-EXP(-30))). This change works very well for fitting the Fisher iris data.
Uday
Thanks for posting this. Do you know how to take this and make an s-curve? Is there a way on excel to make a graph for binary logistic regressions?
Sydney,
You can see a graph of the s-curve on the webpage https://real-statistics.com/logistic-regression/basic-concepts-logistic-regression/
This graph was created in Excel. If you download the examples file you can see how I constructed the graph. See webpage https://real-statistics.com/free-download/real-statistics-examples-workbook/ for how to download the examples file.
Charles
Dear Charles,
I try to follow this example, but I have raw data instead of summarized data. I understad that I should download the Resource Pack, and I tried that, but it did not work on my version of excel (office 365). So my question is how to do this without the resource pack?
Regards,
Erika
Erika,
There is an option for using raw data instead of summary data. See the webpage https://real-statistics.com/logistic-regression/finding-logistic-regression-coefficients-using-newtons-method/
The Real Statistics Resource Pack should work with Office 365. What sort of problem are you having?
If you want to perform the analysis without using the software, you need to duplicate the spredsheets on the referenced webpage plus the conversion from raw to summary data as described on the webpage that I referenced above.
Charles
Dear Dr. Zaiontz,
Thank you for your wonderful website and very useful add-in! I am a senior medical student in the process of analyzing data for a student-initiated study of the individual effects of six, binary independent variables on a binary outcome, which happens to be hospital readmission vs. no hospital readmission.
I was able to do the logistic regression and used Solver to find a coefficient and intercept for each of the variables. I have also found information that will allow me to calculate an odds ratio estimate for each variable using each coefficient.
I am struggling with figuring out how to figure out an upper and lower confidence interval for the coefficient and how to test the null hypotheses (that the independent variables have no impact). I can see how the non-binary data above (rems) and outcomes can be plugged in the Logistic Regression tool to figure out the values in Figure 6 (which I think will then allow me to tackle the challenge of figuring out how to evaluate the significance of our findings), but I do not understand how to input my binary data.
Do you have an example that shows how to use the Logistic Regression tool with a binary independent variable?
Thank you!
Annabel
Dear Annabel,
The approach with categorical independent variables is the same. An example with a binary variable is given on the webpage https://real-statistics.com/logistic-regression/finding-logistic-regression-coefficients-using-newtons-method/
Charles
Thank you!!!
Dear Dr. Zaiontz:
Your comments and the add-in worked very well for our project!
I have one further question: For one of our independent variables, the coefficient was -0.2987, while the 95% CI for the coefficient was calculated as (0.39613, 1.38896). It has been a very long time since I studied statistics (so this project has been very engaging!), and I am struggling with the fact that the lower limit of the CI for our negative coefficient is not negative. The CI does not appear to include 0, but if the lower limit were negative, we would accept the null hypothesis.
Can you help me understand?
Thank you!
Annabel
Dear Annabel,
It sounds like something isn’t quite right. The CI for a coefficient should contain the value of the coefficient. If you send me the spreadsheet where you got this result, I can try to figure what happened.
Charles
Standard Solver can only generate result from a set of data less than 200. How about want to use it for more sets of data ?
I have had no problem using Solver with more than 200 rows of Logistic Regression summary data. In any case, you can always use the Newton method option, as described at https://real-statistics.com/logistic-regression/finding-logistic-regression-coefficients-using-newtons-method/.
Charles
Thanks Charles,
I’m using raw data instead of summary data. How can I summarize the data if I have more than 10 independent variables with 1 binary dependent variable. I can see in your example your only use 1 independent and 1 dependent variable.
Regards
Just follow the approach described in Example 2 of the webpage https://real-statistics.com/logistic-regression/finding-logistic-regression-coefficients-using-newtons-method/. If you prefer to use Solver check the Solver option instead of the Newton’s method option on the dialog box shown in Figure 3. This approach should work with multiple independent variables.
Charles
Hye,
How do you calculate the std error ?
See the following webpage for information about how to calculate the std error: https://real-statistics.com/logistic-regression/significance-testing-logistic-regression-coefficients/.
Charles