Basic Concepts
The Hosmer-Lemeshow test is used to determine the goodness of fit of the logistic regression model. Essentially it is a chi-square goodness of fit test (as described in Goodness of Fit) for grouped data, usually where the data is divided into 10 equal subgroups.
Since this is a chi-square goodness of fit test, we need to calculate the following HL statistic>
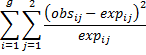
where g = the number of groups (i.e. g = 10). The test used is chi-square with g – 2 = 8 degrees of freedom. A significant test indicates that the model is not a good fit and a non-significant test indicates a good fit.
Example
Example 1: Use the Hosmer-Lemeshow test to determine whether the logistic regression model is a good fit for the data in Example 1 in Comparing Logistic Regression Models.
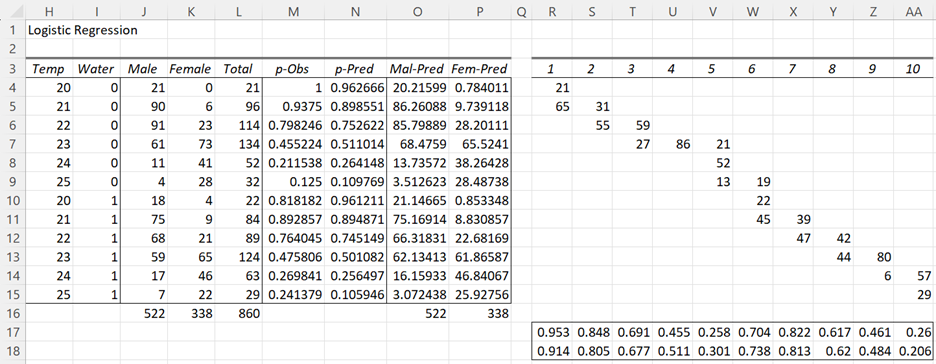
Figure 1 – Hosmer-Lemeshow Test (part 1)
We start with the summary version of the data as shown on the left side of Figure 1 (which is the same as shown in Figure 1 of Comparing Logistic Regression Models). We now need to map the 12 rows of summary data into 10 groups, as shown on the right side of the figure.
Since there are 860 data elements, each group needs to have 860/10 = 86 elements. The first group will contain the 21 elements from row 4 plus 65 of the 90 elements from row 5 (as shown in cells R4 and R5). This leaves 90-65 = 31 elements from row 5 for group 2. The remaining 55 elements for group 2 come from row 6. Etc.
Since 21/86 of group 1’s elements come from row 4 and the remaining 65/86 come from row 5, we will assume that 81.9375 of the 86 elements are male, as calculated by
21 + 65 ⋅ 90/96 = 81.9375
The remaining 86 – 81.9375 = 4.0625 are female. We can calculate this more easily as .953 × 86 = 81.9375 where .953 (the proportion of males in group 1) is calculated by the formula =SUMPRODUCT($M4:$M15,R4:R15)/86 in cell R17. The same approach can be used for the other 9 groups. We can also use the same approach to calculate the proportion of males for group 1 (and the other 9 groups) predicted by the logistic regression model. For group 1 this value is .914, as calculated by the formula =SUMPRODUCT($N4:$N15,R4:R15)/86 in cell R18.
Output
The output from these calculations is shown in Figure 2.
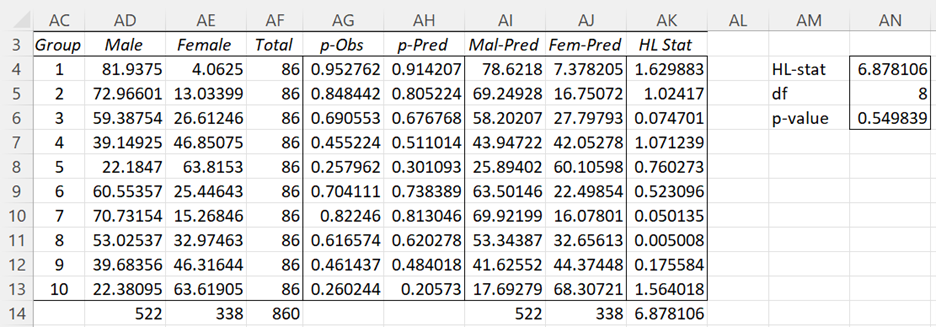
Figure 2 – Hosmer-Lemeshow Test (part 2)
Range AG4:AH13 contains the formula =TRANSPOSE(R17:AA18). Cell AD4 contains the formula =AF4*AG4, cell AE4 contains AF4-AD4, cell AI4 contains AF4*AH4, cell AJ4 contains AF4-AI4, and similarly for the other 9 groups. The
The HL statistic is calculated in cell AK14 via the formula =SUM(AK4:AK13). E.g. cell AK4 contains the formula =(AI4-AD4)^2/AI4+(AJ4-AE4)^2/AJ4.
The Hosmer-Lemeshow test results are shown in range AN4:AN6. The HL stat is 6.878106 (as calculated in cell AK14), df = g – 2 = 10 – 2 = 8, and p-value = CHISQ.DIST.RT(6.878106, 8) = .549839. Since this value is larger than α = .05, we have a non-significant result, which means that the logistic regression is a good fit.
Caution
The Hosmer-Lemeshow test needs to be used with caution. It tends to be highly dependent on the groupings chosen, i.e. one selection of groups can give a negative result while another will give a positive result. For example, when the data is reordered as shown on the left side of Figure 3, the same analysis provides an HL-statistic of 5.931683 (cell AN4 of Figure 4).
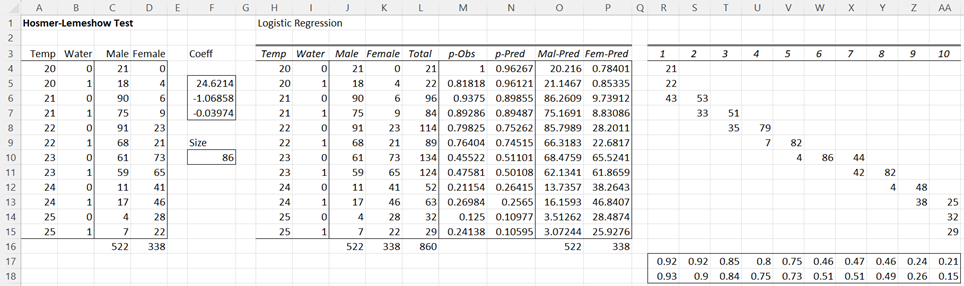
Figure 3 – Revised Hosmer-Lemeshow Test (part 1)
The revised version also shows a non-significant result, although the p-value = .654884 (cell AN6) is different from that shown in Figure 2.
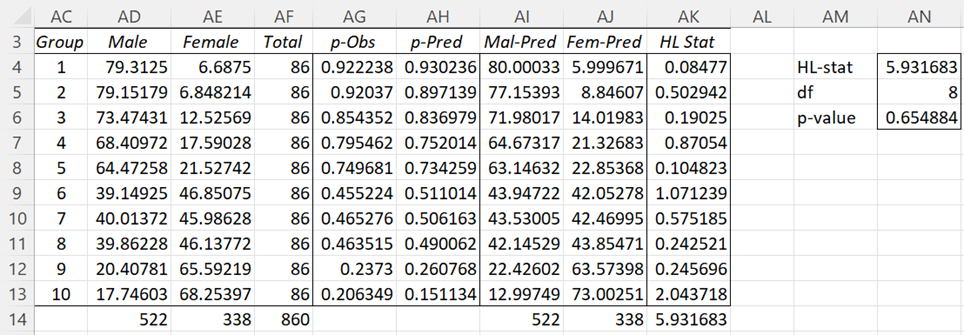
Figure 4 – Revised Hosmer-Lemeshow Test (part 2)
Also, when there are too few groups (5 or fewer) then usually the test will show a model fit. Thus, the test should be used only when the sample has at least 50 elements.
Worksheet Functions
Real Statistics Functions: The Real Statistics Resource Pack provides the following functions.
HOSMER(R1, lab, raw, iter) – returns a table with 10 equal-sized data intervals based on the data in range R1 (without headings)
HLTEST(R1, lab, raw, iter) – returns the Hosmer statistic (based on the table output by the HOSMER function), df, and the p-value.
When lab = TRUE then the output includes column headings and when lab = FALSE (the default) only the data is outputted. When raw = TRUE then the data in R1 is in raw form and when raw = FALSE (the default) then the data in R1 is in summary form. The parameter iter determines the number of iterations used in the Newton method for calculating the logistic regression coefficients; the default value is 20.
Referring to Figure 3, we can use the array formula =HOSMER(A4:D15,TRUE) to obtain the results shown in Figure 5. Note the similarity to the output from Figure 4.
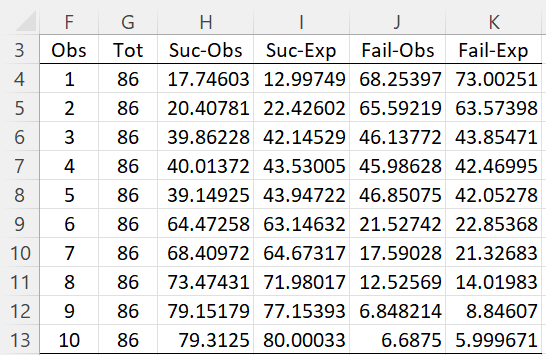
Figure 5 – HOSMER function
We can also obtain the results shown in range AM4:AN6 of Figure 4 can also be obtained using the formula =HLTEST(A3:D15,TRUE). Since the p-value > .05 (assuming α = .05) we conclude that the logistic regression model is a good fit.
Examples Workbook
Click here to download the Excel workbook with the examples described on this webpage.
References
Wikipedia (2013) Hosmer-Lemeshow test
https://en.wikipedia.org/wiki/Hosmer%E2%80%93Lemeshow_test
Agresti, A. (2013) Categorical data analysis, 3rd Ed. Wiley.
https://mybiostats.files.wordpress.com/2015/03/3rd-ed-alan_agresti_categorical_data_analysis.pdf
The link to Comparing Logistic Regression Models (Example 2nd row) is wrong it should be https://real-statistics.com/logistic-regression/comparing-logistic-regression-models/
Hi Umar,
Thanks for catching this error. I just changed the link.
I appreciate your help in improving the website.
Charles
Hi Charles,
the calculation resulting in 81.9375 males in the first group is wrong. In my opinion, it should be: 21+90/96*65 = 81.9375.
Hi Jirka,
Yes, you are correct. I have just changed the webpage.
Thanks for catching this error and helping to improve the website.
Charles
Hi,
I am tryning to find the best model for comparing the logistic regisson and have thought about using hosmer, but after reading the comments to this post I am wondering which model would be best to assess the “model fit”?
Andrew
Hi Andrew,
Yes, I would stay away from the Hosmer-Lemeshow test. I plan to de-emphasize it in the future.
If you are comparing the model with the base model, i.e. the model without independent variables, I would use the chi-square test described on the website. If you are comparing the model with other models then I would use the AIC or BIC value.
Charles
Sir, I have got 3 questions:
1. I have done step wise logistic regression based on Likelihood ratio in SPSS. How to check the model validation other than split sample validation in SPSS?
2. how to remove outliers in the data for logistic regression? I tried removing normalised residuals which are above 2, but again if I run the analysis, again fresh residuals above 2 appear. How to overcome this issue or is it fine with having residuals even if I have them as I get accuracy of above 80%.
3. I have got a sample size of 1429 samples, if I split them as 70-30. I would be getting 1000 odd samples to develop a model. To check the accuracy based on classification matrix, should I construct a model for 1429 samples and directly report it’s accuracy and AUC value. Or should I randomly split the model, develop model with 1000 (70% data)odd samples, check the predicted probabilities on 400 odd samples ( remaining 30% sample) , compare accuracies of both, and report the AUC value based on predicted probabilities and report that AUC value obtained for 30% data?
Kindly help me sir
Sai,
1. I don’t use SPSS and so I am not able to answer your question.
2. In general, you shouldn’t remove sample data outliers, especially with large samples where “outliers” are not unusual. If you find outliers in the residuals, then this is evidence that the model doesn’t fit the data exactly. This is not a surprise.
3. Either approach could be good. You should look at the accuracy and the p-value for the model (and check to see which coefficients are significantly different from zero. You can try both approaches and see whether there is much of a difference.
Charles
Sir,
Before the removal of residuals I had a sample size of 1479 with a accuracy of 73% and after removal of residuals I had a accuracy of 80%, there is slight change in the coefficients of the variables.
But should the data be split into 70 – 30 and check the accuracy of 30 % data based on coefficients obtained from 70% data and check its AUC value, Or report the accuracy of 100% data and its AUC value and report that?
is it checking accuracy and AUC values sufficient to validate the model?
I have already answered your questions a couple of times. I don’t have anything more to add. This is a judgment call. Any of the approaches that have been discussed can be used. The main concern I have is that you are removing residuals to improve accuracy. This will work, but I don’t know of any theoretical justification for doing this. The fact that you get better accuracy from the training data (70% of the data) is not surprising. If you get better accuracy from the test data (30% of the data), then this gives some support for the approach that you have described.
Charles
Yes sir, in the training data and testing data I got about 80% accuracy after removal of residuals but each time I run the analysis I get fresh residuals values which are above absolute value of 2.
My latter question was regarding validation that can we use any other measures to validate the model apart from checking the testing sample accuracy and AUC values? I apologize for repeatedly asking the question as I didn’t frame the question properly. This was the question I wanted to ask.
Also, p-values as stated in previous responses.
Charles
Hello Sir,
I am doing binary logistic regression with about 3000 data points. My Hosmer Lemeshow value is coming almost zero thus suggesting poor model fit. Except for Hosmer value, every other value i.e. p-value, odds ratio, etc coming out quite good. Is a low value of Hosmer is alone sufficient to discard the model? Given that all other results are good?
Thank You
Hello Yusuf,
I would ignore the Homer-Lemeshow value. I don’t think it is such a good indicator, and the value produced by the Real Statistics software is really only a valid Homer-Lemeshow value when there are 10 summary rows.
Charles
Sir, I have developed a binary logistic regression model…..is it necessary to validate it by considering a 70%-30%data split or just get overall prediction data and ROC analysis for 100% data…
Please help me….for 100% data…I got HS test p value as 0.052….and an accuracy of 80%…what can we infer from it….or should I consider 70% data and run the model…and check the model accuracy for 30% of the model…any suggestions
It would be helpful for my dissertation.
Sai,
1. 80% accuracy sounds pretty good to me. If the p-value for the regression is significant, then it seems like you have a good result. I suggest that you also look at which independent variables are significant. You can ignore the Homer-L test; it is not a very indication of the validity of the regression.
2. You can do a 70-30 split, but you need to select the test data randomly. This could be useful but is not essential.
Charles
Sir, I have got 3 questions:
1. I have done step wise logistic regression based on Likelihood ratio in SPSS. How to check the model validation other than split sample validation in SPSS?
2. how to remove outliers in the data for logistic regression? I tried removing normalised residuals which are above 2, but again if I run the analysis, again fresh residuals above 2 appear. How to overcome this issue or is it fine with having residuals even if I have them as I get accuracy of above 80%.
3. I have got a sample size of 1429 samples, if I split them as 70-30. I would be getting 1000 odd samples to develop a model. To check the accuracy based on classification matrix, should I construct a model for 1429 samples and directly report it’s accuracy and AUC value. Or should I randomly split the model, develop model with 1000 (70% data)odd samples, check the predicted probabilities on 400 odd samples ( remaining 30% sample) , compare accuracies of both, and report the AUC value based on predicted probabilities and report that AUC value obtained for 30% data?
Hello Sir, with Hosmer-Lemer Test, can we identify overfitting or underfitting of the model
I don’t really find the Hosmer-Lemer to be very useful, and will eventually remove this webpage. See the following article for further information.
Charles
Dear Sir,
I have calculated statistics like your example, but I am confused if the independent variable consists of 3 variables. how to find exp value for third variable. whereas in the example you gave in Figure 1, look for exp values for women in a 1-ppred * total way
thank you,
liana
Liana,
I suggest that you try such an example using the Real Statistics Resource Pack and look at the formulas that are produced in the output.
Charles
Dear Sir,
I have calculated the HL statistic using your example. It shows that my model is not a good fit. p-value = 0.000016 and alpha = 0.05. I would like to figure out in which decile the test performs badly. Can I just calculate the p-value for each decile using the chidist funtion?
With kind regards,
Jessica
Jessica,
I am not using the true Hosmer-Lemeshow test and so there aren’t any deciles. I would look at other indicators; if they look good then I wouldn’t worry too much about the Hosmer-Lemeshow result.
Charles
Dear Sir:
I’m really curious that how could we get the p-pred value in column K figure 1?
Thank you very much.
With regards
Shirley
Shirley,
See the webpage Finding Logistic Regression Coefficients using Solver.
Charles
Sir
The HOSMER(R1, lab, raw, iter) function fails to calculate the last columns (HL-Suc and HL-Fail). I am using the 2.12 version add-in.
Colin
Colin,
That is correct. As you can see from the comments following Figure 3, the HOSMER function does not calculate these last two columns. They are easy enough to calculate, however. E.g. Cell L41 can be calculated by the formula =(H41-I41)^2/I41 and cell M41 by =(K41-J41)^2/K41.
I will consider adding these columns to the output of the function in the next release.
Charles
Sir
Thank you sir
Colin