We now show how to estimate the statistical power and minimum sample size required for logistic regression.
Topics
- Normally distributed variable case – this webpage
- Binomially distributed variable case
- Real Statistics support
Normally distributed variable case
We begin with the case of one independent variable, i.e. a logistic regression model of form y = β1x + β0. In particular, we assume this variable is normally distributed. We can estimate the minimum sample size when comparing the null hypothesis H0: β1 = 0 with the alternative hypothesis H1: β1 = b by
![]()
where![]()
Recall that![]()
Thus, the null hypothesis is equivalent to ln Odds = β0 or equivalently Odds = exp β0, and so the odds (or equivalently the probability that y = 1) does not depend on the value of x.
We can express the null and alternative hypotheses in terms of Odds, namely
![]()
The odds ratio is![]()
and so b = ln OR. Note too that when the null hypothesis is true then OR = 1.
Let p0 = P(y = 1|x = μx) and p1 = P(y = 1|x = μx+σx). These correspond to the probability that y = 1 based on the null and alternative hypotheses.
Thus for a simple logistic regression model where the independent variable is normally distributed, we can estimate the minimum sample size based on the values of alpha, power, p0 and the odds ratio OR. We can use p1 instead of OR since
![]()
More than one independent variable
If our logistic regression model has more than one independent variable, then we can estimate the sample by n* where
![]()
Here, n is as calculated above and R2 is the value calculated by regressing the independent variable of prime interest (x in the above discussion) on all the other independent variables (using multiple linear regression). Essentially this is equivalent to a logistic regression model just in x where all the other independent variables are set to their mean values.
Example
Example 1: A study is being organized to determine whether older people are more likely to be prescribed opioids for pain. Here x = age (in years) and y = prescribed opioids for pain (1 = yes, 0 = no). We assume that 40% of the people at the mean age (say 50) will get a prescription while 60% of those at a mean age plus one standard deviation (say 60) will get a prescription. We want to determine how big a sample we need to conduct this study (further assuming a 95% significance level and 95% power).
Figure 1 shows that we need a sample of size 83.
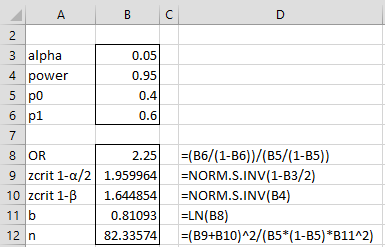
Figure 1 Minimum sample size (normal case)
Suppose we have other independent variables and when the age variable is regressed on them R2 = .60. The minimum sample size would rise to 206 since 82.33574/(1-.6) = 205.8393.
Examples Workbook
Click here to download the Excel workbook with the examples described on this webpage.
References
Hsieh, F. Y., Bloch, D. A., Larsen, M. D. (1998) A simple method of sample size calculation for linear and logistic regression. Statistics in Medicine
https://pubmed.ncbi.nlm.nih.gov/9699234/
Buchner, A., Erdfelder, E., Faul, F., Lang, A-G (2021) G*Power 3.1 manual
https://www.psychologie.hhu.de/fileadmin/redaktion/Fakultaeten/Mathematisch-Naturwissenschaftliche_Fakultaet/Psychologie/AAP/gpower/GPowerManual.pdf
Hsieh, F. Y. (1989). Sample size tables for logistic regression. Statistics in medicine, 8, 795-802.
https://pubmed.ncbi.nlm.nih.gov/2772439/
Great post! I found your explanation on estimating the minimum sample size for logistic regression with normally distributed independent variables very helpful. However, I have a doubt regarding the calculation of sample size when there are multiple independent variables in the logistic regression model. Specifically, I am unclear about how the R2 value calculated by regressing the independent variable of prime interest on all the other independent variables is used in the revised sample size formula. Thank you!
Hi Ana,
1. I believe that I am using the same correction for multiple independent variables as G*Power, namely n* = n/(1-R^2). It does appear that the sample size calculated for one independent variable is not the same as the value calculated by G*Power. E.g. for the example on the Real Statistics website, n = 82.335. When using G*Power I obtain the value n = 84. If I use G*Power with R-square = .9 then I get n* = 832. Since n* = n/(1-R^2), we see that n = 83.2 (which is rounded up to 84). If R-square = .6, then n* = 83.2/(1-.6) = 208, which the value calculated by G*Power. Note that it is not 84/(1-.6) = 210.
2. As expressed in my previous response and reiterated above, the sample size value calculated for one independent variable is not the same as that calculated by G*Power (82.335 vs. 83.2). I need to check as to why this is so. In any case the R-square correction is the same.
Charles