Objective
The Logistics Regression data analysis tool cannot analyze non-numeric data, but alphanumeric (categorical) data can be converted to numeric form using Real Statistics’ Extracting Columns from a Data Range data analysis tool (click here for more details about this tool).
Example
Example 1: Convert the data in range A3:D19 on the left side of Figure 1 to numeric form.
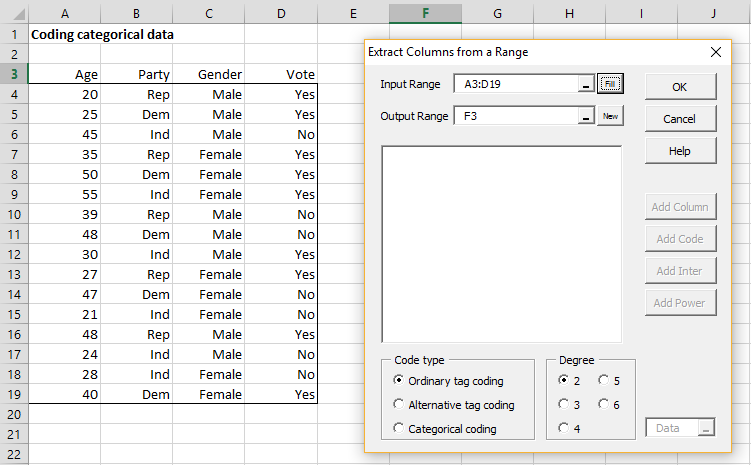
Figure 1 – Categorical coding of alphanumeric data
Press Ctrl-m and choose the Extracting Columns from a Data Range option (from the Desc tab). When the dialog box shown on the right side of Figure 1 appears, insert range A3:D19 into the Input Range field (or highlight the range A3:A19 B3 and then press the Fill button) and press the OK button. The dialog box is now changed as shown in Figure 2.
First, we simply copy column A into the output as shown in Figure 2. This is done by clicking on the Age item in the list of column headings shown in the dialog box and clicking on the Add Column button.
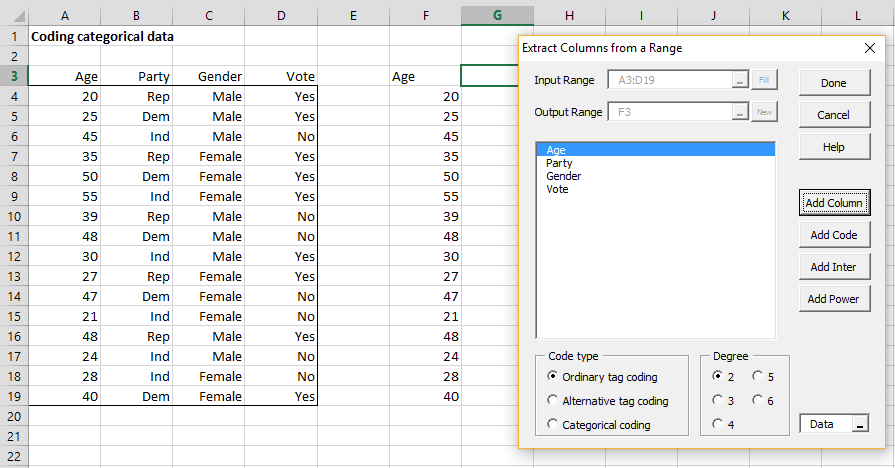
Figure 2 – Extract Columns dialog box
Next, select the Party item in the dialog box and click on the Add Code button. This will use ordinary tag coding (aka dummy coding) to code the Party values. Since there are three values for Party, 3 – 1 = 2 dummy variables will be used.
Next, select both the Gender and Vote items in the dialog box (i.e. click on Gender, and then while holding down the Shift key click on Vote). Now change the Code type to Categorical coding and click on the Add Code button. Finally, click on the Done button to close the Extract Columns from a Data Range dialog box. The result is shown in Figure 3.
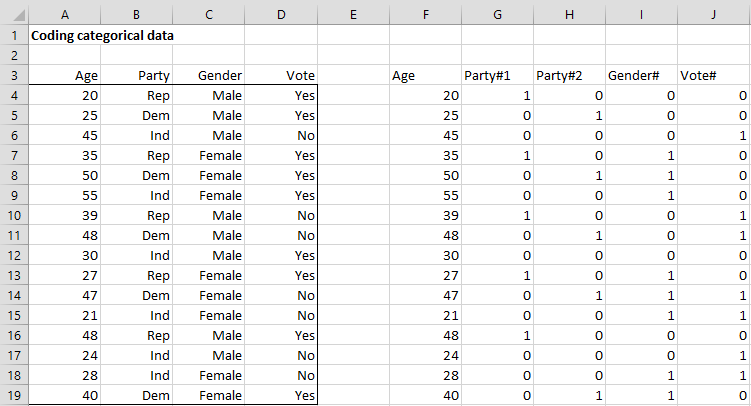
Figure 3 – Categorical coding output
Note that we can also use the Categorical coding option even when the categorical variable contains more than two outcomes. E.g. if we had done this with the Party variable, then the output would consist of one column (instead of two columns) containing 0’s, 1’s, and 2’s. The only problem with this approach for Logistic regression is that an implied order would be assumed, namely Rep < Dem < Ind, since Rep would be coded as 0, Dem as 1, and Ind as 2 (i.e. the order in which they first appear in column B).
Examples Workbook
Click here to download the Excel workbook with the examples described on this webpage.
Reference
Howell, D. C. (2010) Statistical methods for psychology (7th ed.). Wadsworth, Cengage Learning.
https://labs.la.utexas.edu/gilden/files/2016/05/Statistics-Text.pdf
Thank you for the post. Wonderful. I was searching for pivot table and I read here control + m . I tried it. Somewhere I did wrong. I selected data table in excel. I found an icon at bottom right corner; on clicking on it, I found a table named menus: QUICK ANALYSIS/TABLE. I selected PIVOT TABLE and it worked! Thank you very much.
When I was pressing ctrl-m, nothing happened. Did I need to enable any add-ins? Thanks.
You need to install the add-in as described on the webpage from where you downloaded the add-in.
Charles
I did but still does not work, any potential solutions?
Hi Pablo,
What doesn’t work? Can you provide some additional details?
Charles
In your example above, what would be the next step to analyze the data using logistic regression? Which logistic regression analysis tool would you use to determine the influence of age, party, and gender on the voting outcome?
Hello Sher,
You use the same logistic regression tool whether or not you have any categorical data.
When you have categorical data you need to code that data correctly. For example, gender is usually coded as 0 for male and 1 for female (or 1 for male and 0 for female). Assuming there are 3 parties, you can use two variables p1 and p2 where p1 is 1 for Dem and 0 otherwise and p2 is 1 for Rep and 0 otherwise. Age is a numeric variable and does not require special coding (just use a numeric value from 0 to 120), although if age is specified in intervals, say 0-20, 21-40, 41-60, 61-80, 81-100 and 101 or over, then these could be coded by 0, 1, 2, 3, 4, 5, 6 so as to capture the order (or equivalently by the midpoints 10,30,50,70,90,110.
Charles
Hi thank you so much for this helpful tutorial. While I understand that using the Categorical coding option for regression modeling would incorrectly influence the outcome, would the same be true for Correlation modeling?
Jeff,
Glad that you got value from the tutorial.
Often categorical coding (i.e. dummy or tag coding) is the correct approach in regression. It depends on the details. Regression and correlation are related concepts and so the same can be said for correlation.
Charles
Hello Mr Zaiontz,
I am interested to convert categorical data into numerical data as in your example. There is the use of the if function.
In your example, you popup a window using ctrl-m to open the extract column from a range. Is it a special tool from your own, or it is already included in Excel.
If it is included in Excel, could you please indicate me how to acces to this window(extract column from a range) without using the ctrl-m key
Regards,
Hello Alain,
This is a data analysis tool in the Real Statistics Resource Pack. It is not included in standard Excel.
Charles