Data Analysis Tool
Real Statistics Data Analysis Tool: The Real Statistics Resource Pack provides the K-Means Cluster Analysis data analysis tool, which automates the steps described in K-means Cluster Analysis. We show how to use this tool via the following example.
Example 1: Perform cluster analysis to classify the data in range B3:E18 of Figure 1 into 3 clusters.
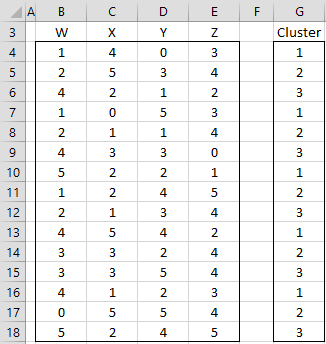
Figure 1 – Data for Example 1
We use the data in range G4:G18 as the initial clusters.
To perform the analysis, press Ctrl-m and select K-Means Cluster Analysis from the Multivar tab. If you are using the original user interface, then double-click on the Multivariate Analyses option from the main menu and then select Cluster Analysis from the dialog box that appears. In either case, fill in the dialog box that appears as shown in Figure 2, and click on the OK button. Note that even if the Input Range contains column headings, no column headings are used for the Initial Clusters or Weights ranges.

Figure 2 – Cluster Analysis dialog box
The output is shown in Figure 3. In particular, the cluster assignment for each of the 15 data elements is shown in range I4:I18.

Figure 3 – Cluster Analysis output
Worksheet Functions
Real Statistics Functions: The following array functions are provided by the Real Statistics Resource Pack and are used by the K-Means Cluster Analysis data analysis tool.
CLUST(R1, k, R2) = m × 1 column range of cluster numbers 1, 2, …, k calculated by the k-means algorithm corresponding to the m n-tuple data elements in the m × n range R1, where R2 is an m × 1 column range containing the initial cluster number assignments. If R2 is omitted, then the k-means++ algorithm is used to calculate the initial cluster number assignments.
ClustAnal(R1, k, iter) = the m × 1 column range of cluster numbers produced by CLUST(R1, k) with the lowest SSE after iter iterations (here each of the iterations uses the k-means++ algorithm). If iter = 0, however, then the m × 1 column range of initial cluster numbers based on the k-means++ algorithm is returned.
The Real Statistics Resource Pack also provides the following array functions.
CLUSTERS(R1, R2) = m × 1 column range of cluster numbers 1, 2, …, k corresponding to the centroid described in the n × k range R2, which is closest to the respective data element in the m × n range R1.
CENTROIDS(R1, R2) = n × k range defining the k centroids corresponding to the m × 1 column range R2 of clusters for the respective data elements in the m × n range R1. Here, k = the maximum value in R2.
CENTROIDS(R1, k) = n × k range defining the k initial centroids corresponding to the data elements in the m × n range R1 based on the k-means++ algorithm
More Worksheet Functions
The Real Statistics Resource Pack also provides the following non-array functions.
CLUSTERErr(R1, R2, k) = SSE value for the data in the m × n range R1 based on the cluster assignment in the m × 1 column range, which contains cluster number assignments based on k clusters 1, 2, …, k.
CENTROIDErr(R1, R2, k) = SSE value for the data in the m × n range R1 based on the centroids described in the n × k range R2.
CLUST_Converge(R1, R2 = True if the m × 1 column array R2 of cluster numbers 1, 2, …, k calculated by the k-means algorithm for the m n-tuple data elements in the m × n range R1 has converged (i.e. one additional iteration of the algorithm does not result in any changes to the cluster assignments.
For Example 1, the formula =CLUST(B4:E18,M9,G4:G18) results in the output shown in range I4:I18 of Figure 3. Range I4:I18 can also be calculated by the array formula =CLUSTERS(B4:E18,M4:O7). The SSE value of 80.83 (cell M18) can be calculated by the formula CLUSTErr(B4:E18, I4:I18, M9) or =CENTROIDErr(B4:E18, M4:O7, M9).
Initializing Clusters
In Example 1, all the clusters were assigned an initial value using the Initial Clusters field. If this field is left blank, then the K-Means Cluster Analysis tool will assign initial cluster values based on the k-means++ algorithm. This is explained in Initializing Clusters via the k-means++ Algorithm.
The k-means++ initialization can be repeated multiple times, in which case the data analysis tool will choose the initialization that yields the best result. The default number of replications is 10, but you can change this value in the Number of Replications field of the dialog box shown in Figure 2. This value is called the # of runs in the output.
If you supply the initial cluster assignments yourself, as in Example 1, then the value in the Number of Replications field is not used and, the # of runs in the output will be N/A (as shown in cell L13 of Figure 3).
Minkowski Distance
All the capabilities described on the webpage are also available for non-Euclidean distance metrics, more specifically for Minkowski distances and weighted Minkowski distances.
For the Euclidean distance case, as described in Example 1, the Minkowski distance p parameter shown in Figure 2 is always set to 2. This value needs to be modified for other Minkowski distances. The Weights Range field in Figure 2 is only used with weighted Minkowski distance analyses; otherwise, it is left blank, as shown in Figure 2.
See Cluster analysis based on Minkowski distances for more details.
Cluster Analysis Plot
For two-dimensional data, you can also use Real Statistics’ Compound Scatter Chart data analysis tool to create a chart of the cluster analysis results. See Compound Scatter Chart for more information. Also see Real Statistics Multivariate GMM Support for an example of how this is done for GMM cluster analysis.
Links
Examples Workbook
Click here to download the Excel workbook with the examples described on this webpage.
References
PennState (2015) K-Mean procedure. STAT 505: Applied Multivariate Statistical Analysis
https://online.stat.psu.edu/stat505/Lesson14#k-means-procedure
Wilks, D. (2011) Cluster analysis
http://www.yorku.ca/ptryfos/f1500.pdf
Wikipedia (2015) K-means clustering
https://en.wikipedia.org/wiki/K-means_clustering
Hello,
I’ve downloaded the Excel add-in but it has Invalid Name Errors and Divide by Zero Errors. Any idea what can be done about that?
Thank you!
Hello,
What do you see when you enter the formula =VER() in any cell?
Charles
I am also facing the same issue
Hello Megha,
What is the (same) issue that you are having?
Charles
Greetings, I would like to ask you a favor, explain to me in an example how the weights range parameter in simple words and the difference between number iterations per run and number replications (andres.paz1991@gmail.com)
Hello Andres,
See https://www.real-statistics.com/multivariate-statistics/cluster-analysis/k-means-cluster-analysis/
The number of iterations = the number of steps in one run of the algorithm as explained on the above webpage.
The number of replications = the number of times the algorithm is run. The best result on any of the runs is used as the output.
Charles
Thank you very much Charles, finally can you explain to me weigth range
See https://www.real-statistics.com/multivariate-statistics/cluster-analysis/real-statistics-k-means/clusters-minkowski-distance/
Charles
Charles, firstly thanks for this free tool.
I have 2 questions about k-means clustering
1) what does the error correspond to in the output?
2) why do the results change if I put anything else on the results worksheet, even if it is several columns away from the output? E.g. if I specified my output would start in cell D1, then I later do a calculation in cell R1, the numbers in my analysis output at D1 change.
Glenda,
1. In the standard case where p = 2, the error is the sum of squared errors (SSE). For Figure 3, this is the sum of the entries in column S.
2. The procedure uses random numbers (i.e. the RAN() formula). This formula is recalculated when cells are changed on a spreadsheet. You can stop this from happening by copying the results and pasting values.
Charles
Hi Charles I need to do k means clustering with values of k = 2,3,4,5,6,7. Not sure how to do this. Where would I put these values at in excel?
Hello Tammi,
You need to install Real Statistics first. You can download it for free from the Real Statistics website.
Charles
Hi Charles,
Thanks for the useful tool. I tried using it for a data set with N=623, set K=6, iteration =10. I left initial cluster blank to run K++ algorithm.
After I got the result,the SSE seems to ‘auto-refresh’ and it generates a different number in the same cell every once in a while.
Why is it? Did I do anything wrong?
And I tried using iteration=20 as well. The same auto-change happens.
It would be great if you can clarify for me.
Also, what is the optimal number of iteration to run? How to find out?
Thank you!
Jane,
If you set an iteration value then random numbers are generated and so the values in the output will change. You can always stop this by copying the output (Ctrl-C) and pasting by values (Alt-ESV-Enter) it somewhere else.
I don’t know an optimum value for the number of iterations. The more the better the results, but the slower the processing.
Charles
Hi Charles, I want to do a Cluster Analysis. Where do I find the tool / main menu for it? I have downloaded and see Data Analysis sheet, but don’t see/ get to figure 2 as described in your instruction. Can you advise. I have the very latest version of Excel . Thanks
Silke
Silke,
The Cluster Analysis examples are in the Multivariate Examples file.
To download this file go to https://real-statistics.com/free-download/real-statistics-examples-workbook/
The Cluster Analysis data analysis tool is under the Multivariate option (or Multivar tab).
Charles
It does work very well. Thanks a lot, Charles!
Hi Charles,
Thank you for the nice explanation on cluster analysis.
I am novice to cluster analysis, I would like to understand more on this.
1. Can you please explain with some real time data for correlating?
2. Using CA segregated the data into clusters and how it helps the business ? please take some real time example and explain ?
3. I heard google use CA for segregating the emails, in this we have only text not numbers. How CA works on text (CA main concept lies in calculating distance from centroid). can you please shed some light on this ?
Thanks & Regards
B N R
Reddy,
1. Sorry, but I don’t understand your question.
2 and 3. These are excellent questions, but I don’t currently have the time to investigate them. Do you have some insights or recommendations?
Charles
Hi Charles,
from your example it is very clear how to perform CA. But in reality I am unable to correlate.
My first question is about:
from your example directly you shown some the data (numbers). But in reality what are those numbers ? What those numbers signify ?
from 2 question I would like to understand real application of cluster analysis from data collection – CA analysis – Inferences from Cluster analysis.
Thanks & Regards
B N R
Reddy,
I understand. I will eventually try to make this clearer, but I only have limited time and am now working on other issues, especially a new release as well as better Mac support.
Charles
Hello Charles:
I want to perform a cluster analysis to a set of variables from a demographics survey. Most of the questions were single option questions, such as: gender (female, male), age (18-25, 26-35, 36-45, 46-55, 55+), race (caucasian, african american, hispanic, asian), marital status (single, divorced, married, etc.), etc. How could I work with this variables in order to run the cluster analysis? Thanks in advance!
Gabriela,
This is described on the referenced webpage. What specific questions do you have?
Charles
I’m a newby to all this. I’ve followed the instructions above, but am getting a compilation error, which points to the fact that I’m mix up 32 bit and 64 bit software and hardware, but I can’t find the VBA module. The error message is “Compile error in the hidden module: frmCluster.
Any help for this man out of his depth welcome. Thanks BTW for the app. Much appreciated. Jim
Jim,
What version of Excel are you using? Is it 32 bit or 64 bit?
What version of Windows or Mac OS are you using?
Charles
Dear All,
I wanted to find out the distance between clusters, please suggest a tool for the same.
mail: gens8094@gmail.com
Dear Ganesh,
Two possible approaches:
1. The Euclidean distance between the centroids
2. The average Euclidean distance between all pairs of points in the two clusters.
See k-means cluster analysis for a definition of the Euclidean distance.
Charles
My output is producing a SSE of 0. All Clusters are then defined as #VALUE and the Centroid values are #DIV/0 errors due to the SSE = 0. Any thoughts on how to troubleshoot this or approach it differently?
MCL,
If you send me an Excel file with your data, I will try to figure out why you are getting this result. You can find my email address at Contact Us.
Charles
This is my first exposure to the tool and my appreciation is expressed to Charles for all of his efforts. This is great stuff.
A quick question on the iteration term. I am used to k-means starting out with some set of points, and subsequently using the centroids of the resultant clusters to seed the next iteration until the SSE is below some threshold.
Let say my iteration term is 10. Am I performing 10 iterations starting with my initial clusters until it converges, or am I performing 10 different processes and taking the best. Confused by the line in ClustAnal “here each of the iterations uses the k-means++ algorithm”
Hi Reagan,
Glad you like Real Statistics. I appreciate your support.
The software performs 10 different processes and takes the best one.
Charles
It is a means to ease life in a reasonable and understandable way
All things supported with example, and most prefered for its
Layout on Excel!
Bless you! Professor Chales zaintoz
Hello, I was wondering where I might be able to download this tool.
Download Real Statistics
Charles