Basic Algorithm
The objective of this algorithm is to partition a data set S consisting of n-tuples of real numbers into k clusters C1, …, Ck in an efficient way. For each cluster Cj, one element cj is chosen from that cluster, called a centroid.
Definition 1: The basic k-means clustering algorithm is defined as follows:
- Step 1: Choose the number of clusters k
- Step 2: Make an initial selection of k centroids
- Step 3: Assign each data element to its nearest centroid (in this way, k clusters are formed, one for each centroid, where each cluster consists of all the data elements assigned to that centroid)
- Step 4: For each cluster, make a new selection of its centroid
- Step 5: Go back to step 3, repeating the process until the centroids don’t change (or some other convergence criterion is met)
There are various choices available for each step in the process.
An alternative version of the algorithm is as follows:
- Step 1: Choose the number of clusters k
- Step 2: Make an initial assignment of the data elements to the k clusters
- Step 3: For each cluster, select its centroid
- Step 4: Based on centroids, make a new assignment of data elements to the k clusters
- Step 5: Go back to step 3, repeating the process until the centroids don’t change (or some other convergence criterion is met)
Distance
There are several ways to define the distance between two n-tuples in the data set S, but we will focus on the Euclidean measure, namely, if x = (x1, …, xn) and y = (y1, …, yn), then the distance between x and y is defined by
Since minimizing the distance is equivalent to minimizing the square of the distance, we will instead look at dist2(x, y) = (dist(x, y))2. If there are k clusters C1, …, Ck with corresponding centroids c1, …, ck, then for each data element x in S, step 3 of the k-means algorithm consists of finding the value j which minimizes dist2(x, cj); i.e.
![]()
If we don’t require that the centroids belong to the data set S, then we typically define the new centroid cj for cluster Cj in step 4 to be the mean of all the elements in that cluster, i.e.
![]()
where mj is the number of data elements in Cj.
If we think of the distance squared between any data element in S and its nearest centroid as an error value (between a data element and its prototype), then across the system, we are trying to minimize
Initial Choice
There is no guarantee that we will find centroids c1, …, ck that minimize SSE and a lot depends on our initial choices for the centroids in step 2.
Property 1: The best choice for the centroids c1, …, ck are the n-tuples which are the means of the C1, …, Ck. By best choice, we mean the choice that minimizes SSE.
Click here for a proof of this property (using calculus).
Example
Example 1: Apply the second version of the k-means clustering algorithm to the data in range B3:C13 of Figure 1 with k = 2.
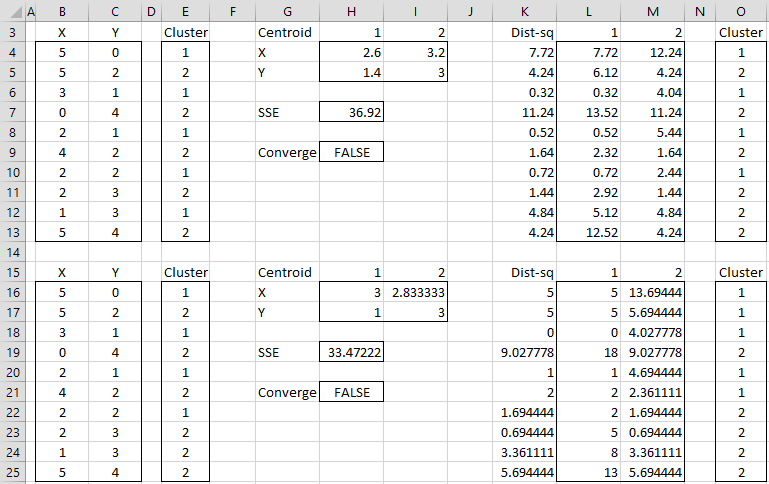
Figure 1 – K-means cluster analysis (part 1)
The data consists of 10 data elements, which can be viewed as two-dimensional points (see Figure 3 for a graphical representation). Since there are two clusters, we start by assigning the first element to cluster 1, the second to cluster 2, the third to cluster 1, etc. (step 2), as shown in range E3:E13.
We now set the centroids of each cluster to be the mean of all the elements in that cluster. The centroid of the first cluster is (2.6, 1.4), where the X value (in cell H4) is calculated by the formula =AVERAGEIF(E4:E13,1,B4:B13) and the Y value (in cell H5) is calculated by the worksheet formula =AVERAGEIF(E4:E13,1,C4:C13). The centroid for the second cluster (3.2, 3.0) is calculated similarly.
We next calculate the squared distance of each of the ten data elements to each centroid. E.g. the squared distance of the first data element to the first centroid is 7.72 (cell L4), as calculated by =(B4-H4)^2+(C4-H5)^2 or equivalently =SUMXMY2($B4:$C4,H$4:H$5). Since the squared distance to the second cluster is 12.24 (cell M4) is higher, we see that the first data element is closer to cluster 1, and so we keep that point in cluster 1 (cell O4). Here, cell K4 contains the formula =MIN(L4:M4), and cell O4 contains the formula =IF(L4<=M4,1,2).
Convergence
We proceed in this way to determine a new assignment of clusters to each of the 10 data elements as described in range O4:O13. The value of SSE for this assignment is 36.92 (cell H7). Since the original cluster assignment (range E4:E13) is different from the new cluster assignment, the algorithm has not yet converged, and so we continue. We simply copy the latest cluster assignment into the range E16:E25 and repeat the same steps.
After four steps, we get convergence, as shown in Figure 2 (range E40:E49 contains the same values as O40:O49). The final assignment of data elements to clusters is shown in range E40:E49. We also see that SSE = 22.083 and note that each step in the algorithm has reduced the value of SSE.
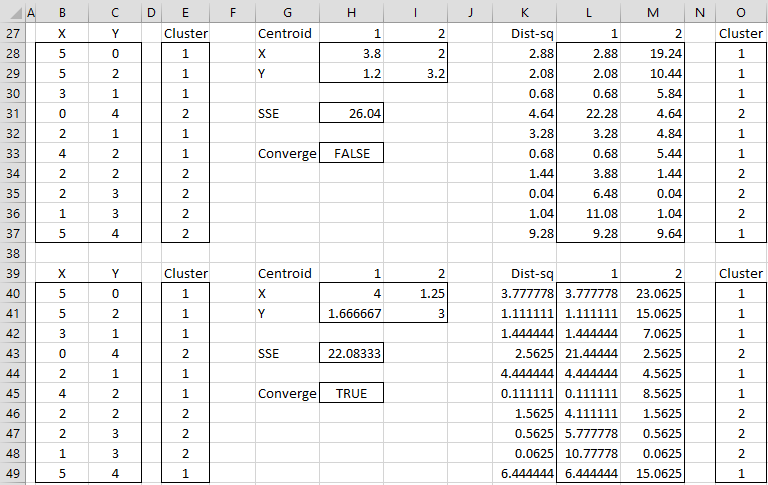
Figure 2 – K-means cluster analysis (part 2)
Graph of Assignments
Figure 3 graphically shows the assignment of data elements to the two clusters. This chart is created by highlighting the range B40:C49 and selecting Insert > Charts|Scatter.
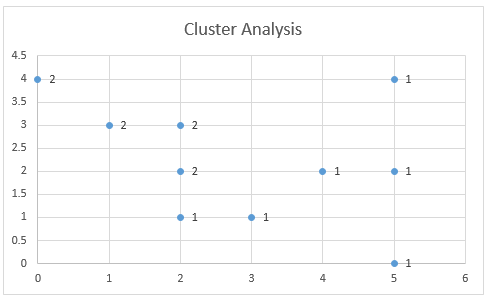
Figure 3 – Cluster Assignment
You can add the labels (1 and 2) to the points on the chart shown in Figure 3 as follows. First, right-click on any of the points in the chart. Next, click on the Y Value option in the dialog box that appears, as shown in Figure 4.

Figure 4 – Adding labels containing cluster assignment
Links
Examples Workbook
Click here to download the Excel workbook with the examples described on this webpage.
References
PennState (2015) K-Mean procedure. STAT 505: Applied Multivariate Statistical Analysis
https://online.stat.psu.edu/stat505/Lesson14#k-means-procedure
Wilks, D. (2011) Cluster analysis
http://www.yorku.ca/ptryfos/f1500.pdf
Wikipedia (2015) K-means clustering
https://en.wikipedia.org/wiki/K-means_clustering
Dear Dr Zaionitz, please a don´t know what happen whit cluter analysis, using Spanish Excel. The roults from the example, show mistakes as: #valor!
Thanks
Gerardo,
Sorry for the delay in responding. I was busy getting out the latest software release.
If you email me an Excel spreadsheet with the results you got, I will try to figure out what is going wrong.
Charles
Hello.
Thank you for providing Add-in program for free.
I have a question about setting the numbers for k-means clustering. What does”Number of replications” stands for and how can I set the proper value?
Also, could you explain briefly about “Weight range”, please?
Thank you.
Hello,
Excellent questions and I apologize for not being clearer.
I have now modified the webpage by adding two final sections called Initializing Clusters and Minkowski Distance. These sections will address the questions you have raised.
Thank you very much for bringing this issue to my attention.
Charles
Hi Charles,
Would appreciate if u can upload a video, how to run this analysis.
Thanks,
WC
I am sorry, but I don’t have a video to upload. Perhaps the following webpage will help:
https://www.real-statistics.com/multivariate-statistics/cluster-analysis/real-statistics-k-means/
Do you have a specific question about how to run the analysis that isn’t explained on the website?
Charles
Sir,
I don’t quite understand on the interpretations. For example, SSE result, number reduced the better? And is it correct that we need to repeat the steps until the Converge result become TRUE?
Last question, about Step 2: Make an initial assignment of the data elements to the k clusters, does this mean we randomly assign the data to a cluster initially?
1. SSE is an error measurement. Yes, the smaller the value of SSE the better.
2. Ideally, you should repeat the steps until Converge = TRUE, but for more complicated cases, this may not be practical (since the run time may be very long).
3. You can make random initial assignments, but it is better to use the approach described at the following webpage
https://www.real-statistics.com/multivariate-statistics/cluster-analysis/initializing-clusters-k-means/
Charles
please tell me how to calculate please tell me how to calculate Convergence
Convergence occurs when the cluster assignments don’t change from one step to the next.
Charles
Sorry I did not make myself clear. In this cluster analysis, the final groups (1 and 2) have the minimized possible variance within groups and the maximized possible variance between groups (as I understand). I would like to perform a clustering in which the variance between the groups is the minimum.
When you speak about the variance between groups, are you referring to the pooled variance (as for the two independent sample t-test?
My first reaction is to randomly assign the data to the two clusters, but this may or may not be the correct way to minimize the variance.
Charles
Hi Charles,
Is it possible to perform a cluster in which all the final groups have the most possible similar mean of each subject (X and Y)?
Thank you!
Sorry, but I don’t understand your question.
Charles
Halo Charles,
Please help me, could you explain to me how I can run a clusterization algorithm X-Means using Excel?
Siti,
I haven’t yet addressed this topic. See
https://www.researchgate.net/publication/2532744_X-means_Extending_K-means_with_Efficient_Estimation_of_the_Number_of_Clusters
Charles
Thank you for the great program.
K means cluster analysis, 220 lines of data, 4 clusters, 20 iterations: how long should the analysis take? I have been waiting for 10 minutes and I’m not sure if EXCEL crashed or not 🙂
Hello Vincent,
I suggest that you try again with iterations set to 1 and see whether you have the same problem. If not increase the number of iterations a bit to see what happens.
Charles
Hi Charles, I let it run the whole night and I think it had crashed. Tried again with 100 iterations and 4 clusters and it worked. Tried with 20 clusters and 10 iterations and it worked too. Strange. Thank you for your reply!
Hello Charles,
thank you for this important resource.
I am new to advanced statistics and I have a question:
let’s say I have 3 variables and I want to split those istances into 6 clusters.
Using your tool the result give me every x,y,z point labeled with the calculated cluster.
Is there an easy way to know the boundaries of those clusters? I mean the range of x,y,z that characterize each cluster?
I don’t know if I’ve been clear enough.
Thank you again.
Hello Alessandro,
The k means test doesn’t necessarily result in such nice boundaries. Jenk’s Natural Breaks does provide such boundaries. See
https://real-statistics.com/multivariate-statistics/cluster-analysis/jenks-natural-breaks/
Charles
Hi Charles
Can you explain to me how I can run a clusterization algorithm with 3 centroids and can I at all (I have 10 points from A to J with 2 coordinates x and y)?
This is explained on this webpage. You can perform this cluster analysis with 10 points, each with 2 coordinates, using 3 centroids.
You can also use the Real Statistics software to perform most of the work for you.
Charles
Hello Charles,
When you assign items to different groups or clusters, you then calculate the new centroids. How do you deal with a group that has been assigned no item at all?
Apart from the trivial issue of a division by zero, how do you choose new centroids?
Many thanks!
Fred
Fred,
See the following webpage for how to deal with this case:
https://stackoverflow.com/questions/11075272/k-means-empty-cluster
Charles
hi charles, how to know k-th observer and itininary optimum
Yayan,
Sorry, but I don’t understand your question.
Charles
dear charles i meant what k or number cluster which the best and how many iter too..
Yayan,
How do decide what “best” value of k means? What criteria do you want to use?
Regarding iter, the more the better. The larger the value of iter the more time it will take, but the more accurate the result.
Charles
Hi Charles,
I just wanted to let you know that I found a small typo in your text.
“Figure 3 graphically shows the assignment of data elements to the two clusters. This chart is created by highlighting the range B40:B49 and selecting Insert > Charts|Scatter.”
I think you mean B40:C49. Please correct me if I am wrong.
Anders,
Thanks for identifying this typo. I have now made the change that you have suggested.
I really appreciate your help in improving the website. Thanks to you and others like you, the website is constantly reviewed and errors are identified and corrected.
Charles
SIR DO YOU KNOW K HARMONIC ALGORITHM?HOW TO TAKE THE DATA SET?
Charles
Interesting Information
Can Please explain, how did you calculate SSE and Converge.
Thanks
Sreeram,
SSE is =SUM(K4:K13)
Converge is =AND(E4:E13=O4:O13)
Charles
Charles can u help me how to find centroid plus I want to calculate precision and recall using clustering
Aneela,
These topics are described on the referenced webpage. What specific problem are you having?
Charles
good day dr. charles
im using k-means clustering using WEKA and i verified the result using excel..the result did not match..is this possible? please help
my data sample is this
Z Grade1 Grade2 Grade 3 Final Remark
1 78 85 82 80 Passed
0 80 94 90 88 Passed
etc……..
by the way ….if i omit the REMARK attribute in WEKA..the result is similar to excel..but if it is included in the data set..the result is not the same…thank you in advance for your help
Rey,
I am not familiar with WEKA and so I can’t comment on why there is a difference.
Charles
Dear Charles,
What limitations are build in for using the k-means cluster calculation?
I have a time series with 7707 elements (temperature, opening degree of valve).
I have been testing with 2, 3, 4 and 5 clusters and the calculations were working fine, but suddenly at 6 clusters i only got errors back from excel!
in de the calculated cluster column it was #value and in the other tables it was #div/0
Can you give me an indication to solve the problem
Dear Thiery,
The number of calculation grows very fast as the number of clusters increases. You should expect that the calculations should start to slow down a lot at 6 clusters. I am surprised that an error was generated.
If you send me an Excel file, I will try to figure out what is going on. You can find my email address at Contact Us.
Charles
Thank you so much.
Could you please use the same example and show to us how to calculate
matrix SSB and also SSW and pseudo F test ?
I would appreciate very much.
Sanja
Sanja,
I will add this to my list of enhancements. Once I finish the work I am doing now, I will likely add this.
Charles
Please advise me. If I have big data for example iris data and I would like to divide it into four clusters. How am I going to choose the centroids or calculate it?
The referenced webpage shows how to do this. Alternatively, you can use the Cluster Analysis data analysis tool, as explained on the following webpage
Real Statistics support for cluster analysis.
Charles
please tell me how to calculate SSE
Dipak,
The formula to calculate the SSE value in cell H7 is =SUM(K4:K13). The mathematical formula is given just before Property 1 on the referenced webpage.
Charles
Dr. Charle, muchas gracias.
Excelente, pedagógico y sencillo ejemplo.
Gracias
GAD
Dr. Charle, muchas gracias. Excelente y pedagógico ejemplo.
Gracias
GAD